This is the core problem with applying traditional monitoring to LLM applications. According to Braintrust, an LLM app can return a technically successful response while producing incorrect, harmful, or low-quality output. Uptime, error rate, and latency tell you the pipes are working — not whether the water is clean.
LangChain's 2025 State of Agent Engineering survey of 1,300+ professionals found output quality was the top production blocker at 32%, ahead of latency (20%) and security (25% for large enterprises). Teams aren't struggling to keep their LLM infrastructure running — they're struggling to know whether it's working well.
LLM observability addresses this gap. It gives you the ability to understand not just whether your system is up, but whether it's producing trustworthy, cost-efficient, high-quality outputs — and why it isn't when something goes wrong.
This post covers what observability means in the LLMOps context, how it differs from standard monitoring, the four core pillars it rests on, and how to implement it in practice.
Key Takeaways
- LLM observability goes beyond uptime checks to cover output quality, cost, safety, and behavioral drift
- Traditional monitoring metrics fail for LLMs because outputs are free-form and non-deterministic
- Tracing, metrics, logs, and evaluations are the four pillars of LLM observability — and they only work when treated as a system
- RAG systems, agents, and multi-agent architectures each introduce distinct observability requirements
- Start with complete structured logging and basic metrics before adding sophisticated eval pipelines
What Is Observability in LLMOps?
LLM observability is the ability to understand the internal state and behavior of an LLM application through its outputs, traces, and associated metadata — covering the full execution path from user input through model inference to final response.
Arize defines it as complete, real-time visibility into every layer of an LLM-based system, from development through production. That breadth matters.
LLMOps observability isn't a standalone add-on bolted on at the end. It's a continuous feedback loop that informs prompt engineering, model selection, cost control, and safety decisions throughout an application's production life.
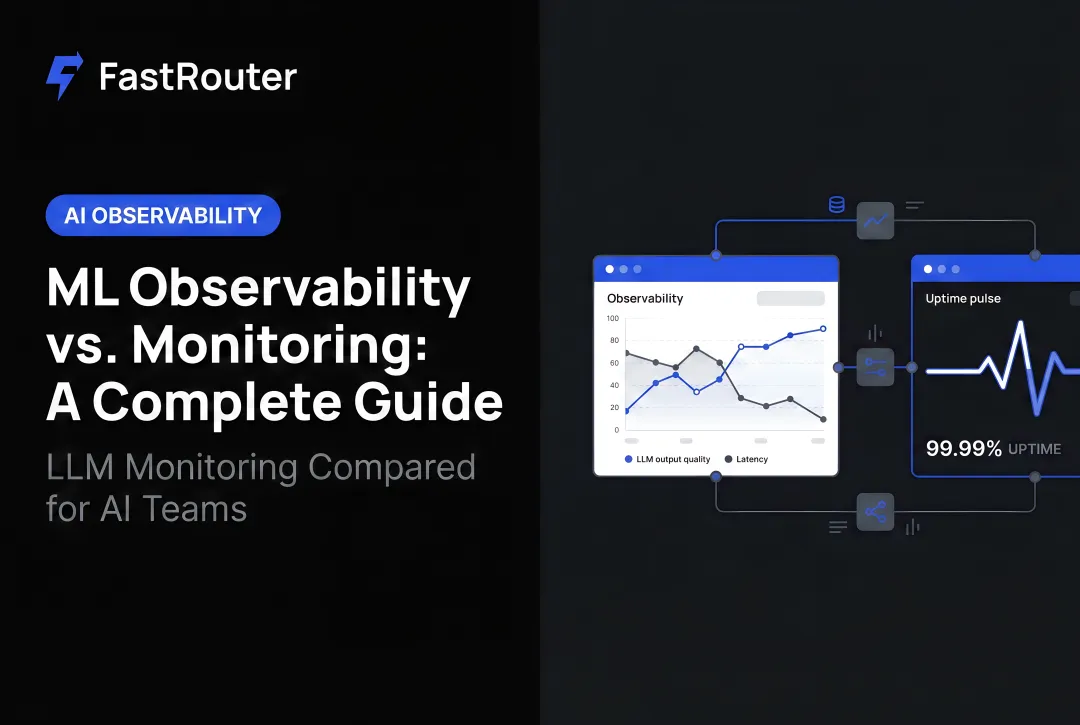
Observability vs. Monitoring
The two concepts are often conflated, but they answer different questions:
- Monitoring tells you something is wrong — latency spiked, error rate increased, a threshold was breached
- Observability lets you ask arbitrary questions about why — which prompt template triggered the issue, which model provider was involved, what the input token distribution looked like at the time
A monitoring alert says "P95 latency jumped." Observability lets you pull those specific traces, filter by model provider, correlate with prompt template changes, and pinpoint the cause — without having known in advance what to look for.
That gap — between knowing something broke and understanding why — is exactly why LLMOps requires purpose-built tooling rather than repurposed APM dashboards.
How LLM Observability Differs from Traditional Monitoring
Traditional MLOps monitoring was built around a core assumption: outputs are scalar values you can compare against ground truth. Accuracy, precision, recall: these metrics work when the model outputs a class label or probability score.
LLMs break that assumption entirely. Outputs are free-form text, and there's no single ground truth for "was this response good?" You can't write a threshold alert for quality. Three structural differences explain why LLM observability requires a purpose-built approach.
The Non-Determinism Problem
Unlike deterministic software or classical ML models, LLMs can return different outputs for identical inputs across calls. A 2025 arXiv study tested five LLMs configured for deterministic settings across eight tasks and ten runs — and found significant non-determinism even under supposedly deterministic configurations.
This breaks assumption-based alerting. You can't establish a stable baseline if the system's behavior varies inherently.
Complex Execution Chains
Modern LLM applications aren't single API calls. They involve:
- Query embedding and vector retrieval
- Context assembly and prompt construction
- Model inference (possibly across multiple providers)
- Tool calls and external API interactions
- Response post-processing and safety checks
A failure or quality issue can originate at any node. Traditional monitoring only sees the final response. Observability must span the entire execution trace to be useful.
LLM-Specific Failure Modes
These have no equivalent in traditional monitoring and require purpose-built evaluation approaches:
- Hallucination — factually incorrect outputs stated with confidence
- Prompt injection — OWASP's LLM01:2025 identifies this as prompts that alter model behavior in unintended ways
- PII leakage — NIST's 2024 Generative AI Profile identifies unauthorized disclosure of personal information as a distinct generative AI risk
- Output toxicity — requiring automated classification, not threshold-based alerts
- Semantic drift — gradual, silent degradation of output quality over time
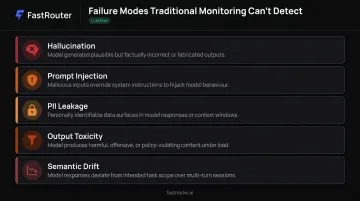
None of these surface in a latency graph.
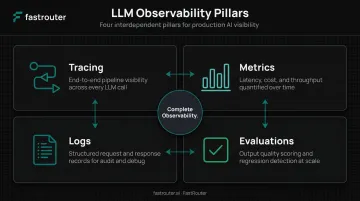
The Core Pillars of LLM Observability
Pillar 1 — Tracing
A trace captures the end-to-end execution flow of a single LLM request as a series of spans — discrete units of work with start/end times, inputs, outputs, and metadata.
The OpenInference specification (built on OpenTelemetry) standardizes span types for LLM systems, including: LLM, AGENT, CHAIN, TOOL, RETRIEVER, RERANKER, EMBEDDING, GUARDRAIL, and EVALUATOR. Each span should capture:
- Start and end timestamps
- Input and output content
- Token counts (prompt and completion)
- Model identifier and provider
- Cost estimate for that span
Traces become essential when debugging multi-step pipelines. Without them, you're guessing which of a dozen components caused the bad output.
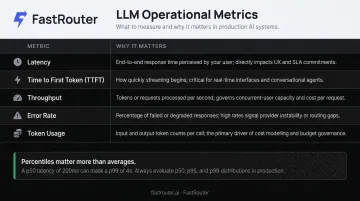
Pillar 2 — Metrics
Operational metrics for LLM production systems cover different ground than traditional APM:
| Metric | Why It Matters |
|---|---|
| Latency (P50, P95, P99) | Averages hide tail behavior that kills UX |
| Time-to-first-token (TTFT) | Critical for streaming response feel |
| Throughput (tokens/sec) | Indicates serving capacity |
| Error rate | Catches provider failures and rate limits |
| Token usage per request | Direct cost proxy |
Percentiles matter more than averages here. A P99 latency of 30 seconds on a P50 of 1.5 seconds indicates a serious tail problem that averages completely obscure.
These metrics need segmentation by model provider, application endpoint, and user cohort to drive decisions — aggregate numbers are mostly noise.
Pillar 3 — Logs
Structured logging in LLMOps goes well beyond error logs. Effective logs capture:
- Prompt templates used (and their version)
- Model configuration parameters (temperature, top-p, max tokens)
- Session context, including conversation history where relevant
- Fallback triggers (when the system switched to a backup model)
- Request routing decisions
Privacy controls are non-negotiable in production. For applications handling sensitive data:
- Log prompt hashes rather than raw content
- Implement PII redaction before storage
- Establish clear retention policies aligned with your compliance requirements
Logs need enough context to support post-incident investigation without storing data you shouldn't retain.
Pillar 4 — Evaluations (Evals)
Evals are how you measure whether LLM outputs are actually good — something the other three pillars can't answer. Automated scoring methods include:
None of these pillars works in isolation — their value comes from correlation. Consider a concrete example: eval scores start dropping across a customer-facing endpoint. You pull the traces for low-scoring requests and spot a pattern in the span data. Cross-referencing with logs reveals a prompt template version was updated three days prior. Metrics confirm token consumption climbed in the same window.
Pull any single pillar out and that chain breaks. Without evals, you never notice the regression. Without traces, you can't isolate which component changed. Without logs, the template version is invisible. Without metrics, you miss the cost impact entirely.
Key Signals and Metrics to Track in LLM Production
Quality Signals
For output quality monitoring, the RAG Triad from TruLens provides a useful framework even outside RAG contexts:
- Relevance — does the response address the actual query?
- Groundedness — are claims supported by provided context?
- Answer relevancy — is the response directly useful?
Beyond relevance, track safety flags (toxicity, bias, harmful content) and factual accuracy where verifiable ground truth exists.
Cost and Efficiency Signals
Token usage is your cost driver, and it compounds fast. Track:
- Input vs. output token counts per request (output tokens typically cost more)
- Cost per request by model and provider
- Cache hit rate — OpenAI's prompt caching can reduce input token costs by up to 90% and latency by up to 80% for eligible repeated prompts
- Expensive query patterns (unusually high token counts worth investigating)
Unchecked prompt verbosity or unnecessary multi-call chains are common sources of budget overruns. Without token-level visibility, cost spikes are indistinguishable from normal growth until the invoice arrives.
Operational Health Signals
Cost and efficiency signals tell you what you're spending — operational health signals tell you whether your infrastructure is holding up. Track:
- Provider API error rates and rate limit hits
- Fallback activation frequency (how often you're routing to backup models)
- Request queue depth under load
These matter especially when routing across multiple providers. A spike in fallback activation frequency tells you a provider is degrading before their status page does.
Behavioral Drift Signals
AWS defines LLM drift as gradual degradation caused by changes in data distributions or user behavior — inputs shift, and outputs drift away from original intent. This is silent by nature.
A concrete example from research: Chen, Zaharia, and Zou found GPT-4's accuracy on a specific task dropped from 84% in March 2023 to ~51% by June 2023 — without any announcement. Teams monitoring only latency and errors would have missed it entirely.
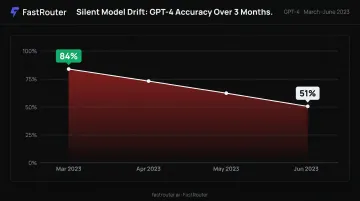
Embedding-based drift detection — comparing the distribution of query embeddings over time — can surface this pattern before users start complaining.
Observability Across LLM Application Complexity
RAG Systems
RAG pipelines require observability at two distinct stages, not just the LLM call.
At the retrieval stage, you need to trace:
- Whether retrieved chunks were actually relevant to the query
- How many tokens the assembled context consumed
- Whether the model's response is grounded in retrieved content or hallucinating beyond it
The RAGAS Context Precision metric evaluates whether relevant retrieved contexts are ranked higher than irrelevant ones — a retriever quality issue that's invisible if you only monitor the final answer.
Agentic Applications
Agents introduce a fundamental challenge: the trace structure isn't known at request time. The LLM decides at runtime which tools to invoke, how many reasoning steps to take, and whether to loop. This means:
- Traces have variable length and nested structure
- Standard fixed-schema monitoring breaks down
- New failure modes emerge — infinite loops, runaway tool calls, compounding errors across reasoning steps
This makes agent observability fundamentally different from request-response monitoring — your tooling needs to capture the entire decision path, not just the final output.
Multi-Agent Systems
Multi-agent architectures push observability into distributed tracing territory. When multiple agents collaborate across service boundaries, individual agent traces must be stitched together into a single coherent view of the original intent. Propagation standards like W3C Trace Context make this cross-service correlation possible.
As agent count and interaction complexity grow, the volume of trace data, spans, and evaluation requirements scales significantly. At production scale, the observability infrastructure needs to function more like a data analytics platform than a logging service — with the ability to query across traces, aggregate failure patterns, and surface cost anomalies across the entire agent network.
That shift in scale also changes what you need from your tooling. Multi-agent observability typically requires:
- Distributed trace correlation across agent boundaries using shared trace IDs
- Span-level cost attribution to isolate which agent or tool call is driving expense
- Anomaly detection for runaway loops or unexpectedly deep reasoning chains
Putting LLM Observability Into Practice
Start with Foundations
Before building sophisticated eval pipelines, get the basics completely in place. A thin but complete foundation is more valuable than a sophisticated but partial one.
Every request should log:
- Latency (end-to-end and TTFT for streaming)
- Token counts (input and output separately)
- Model used and provider
- Cost estimate
- Error type if applicable
Once you have 100% coverage on these basics, layer in automated quality evals and anomaly detection.
Build a Feedback Loop
Production observability data should flow directly back into the development process:
- Surface low-quality traces to prompt engineers for iteration
- Flag high-cost query patterns for optimization
- Use eval score trends to trigger model version reviews
- Route expensive tasks to cheaper models where quality is maintained
Teams that close this loop consistently catch degradation early — before users do.
Using a Unified Observability Platform
Running separate tools for tracing, metrics, logging, and evals creates its own maintenance burden — and makes it harder to correlate signals across the stack. A unified platform reduces that overhead by keeping everything in one place.
FastRouter is built around this model: a single OpenAI-compatible LLMOps control plane that covers:
- Real-time observability and trace logging
- Multi-provider routing across 100+ models
- Cost governance and budget controls
- Guardrails and safety enforcement
- Automated evaluations and quality scoring
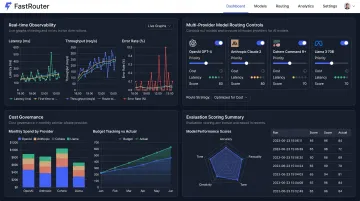
One endpoint, one dashboard, and no cross-tool integration to maintain.
Frequently Asked Questions
What is observability in LLM?
LLM observability is the practice of understanding the internal state and behavior of an LLM application through its outputs, traces, metrics, logs, and evaluations. It enables teams to diagnose quality issues, track performance trends, and optimize cost and safety in production — going beyond simple uptime monitoring.
What are the 4 pillars of LLM observability?
The four pillars are:
- Tracing — capturing end-to-end execution paths as spans across each step in the pipeline
- Metrics — latency, throughput, token usage, and error rates
- Logs — structured records of prompts, configurations, and routing decisions
- Evaluations — automated and human quality/safety scoring of model outputs
How is LLM observability different from traditional ML monitoring?
Traditional ML monitoring checks scalar outputs against known ground truth. LLM observability must handle free-form, non-deterministic outputs with no fixed ground truth, complex multi-step execution chains, and failure modes like hallucination, prompt injection, and semantic drift — none of which threshold-based alerting can detect.
What metrics should I track for LLM observability in production?
Four categories cover the essentials:
- Output quality — evaluation scores measuring response accuracy and relevance
- Operational performance — latency percentiles, error rates, and time-to-first-token (TTFT)
- Token usage and cost — per-request spend broken down by provider
- Behavioral drift signals — early indicators of silent degradation before users report issues
What is distributed tracing in LLMOps and why does it matter?
Distributed tracing links all execution spans across a multi-step or multi-agent LLM pipeline into a single coherent view. It makes it possible to identify exactly where in a chain — retrieval, prompt construction, inference, tool call — a failure or quality issue originated, rather than only seeing that the final response was wrong.
How does LLM observability help with cost management?
By tracking token consumption and provider costs at the request level, observability data lets teams identify expensive query patterns, find prompt verbosity driving unnecessary costs, and make evidence-based decisions about routing specific task types to more cost-efficient models.