Traditional APM tools don't solve this. A 200 OK response with 180ms latency tells you nothing about whether the model hallucinated, leaked sensitive context, or quietly drifted from what it was doing last month. You need a different category of tool.
This guide evaluates the five best LLM observability platforms specifically for startups — not enterprise teams with dedicated MLOps staff. The criteria: fast setup, accessible pricing, multi-provider support, and enough depth to catch issues before users notice them.
Key Takeaways
- LLM observability captures prompt-response pairs, token costs, latency, and quality signals — not just uptime.
- Startups need tools that integrate in hours, not weeks, and don't require seat-minimum contracts.
- The best platforms combine tracing, cost tracking, and routing in one place — no multi-vendor patchwork.
- Top picks for startups: FastRouter, Langfuse, Helicone, Portkey, and PostHog.
- Evaluate on: integration speed, pricing model, multi-provider support, evaluation depth, and non-engineer access to quality reviews.
What Is LLM Observability and Why Do Startups Need It?
LLM observability means being able to see what your model is doing in production: every input, every output, token counts, latency, cost, and quality signal across every request. It's distinct from traditional application monitoring for one critical reason — a successful HTTP response doesn't mean a useful answer.
A model can return a 200 OK in 40ms and still hallucinate a product feature that doesn't exist, recommend a policy you discontinued, or respond in a way that creates legal exposure. Stanford HAI found that legal AI tools hallucinated in 1 out of 6 or more benchmark queries — and those are controlled conditions, not production traffic.
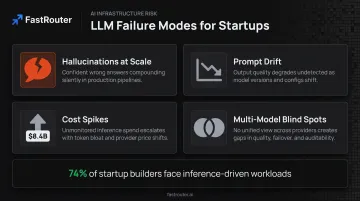
Startups face this problem with fewer safety nets than enterprises. The failure modes that hit hardest:
- Hallucinations at scale — no QA team to catch them before users do
- Prompt drift — model updates or context changes silently degrade output quality over weeks
- Cost spikes — token usage compounds fast. Model API spending more than doubled to $8.4B by mid-2025, and startups feel it hardest: 74% of startup builders report inference-driven workloads vs. 49% of large enterprises
- Multi-model blind spots — when you're switching between OpenAI, Anthropic, and open-source models, no single provider dashboard shows the full picture
Without visibility into these signals, you're debugging blind — which is why the platform you choose to handle observability matters as much as the models themselves.
What to Look for in an LLM Observability Platform as a Startup
Not all observability criteria matter equally at the startup stage. Here's what to actually prioritize:
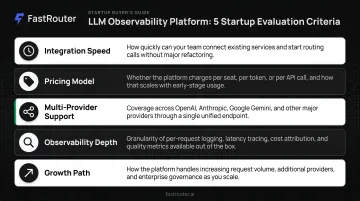
Integration Speed
Startups can't spend a sprint on instrumentation. Look for tools that integrate via a single base URL swap, SDK wrapper, or OpenAI-compatible proxy — not ones that require rewriting application code or standing up new infrastructure. The target should be hours to first logged request, not days.
Startup-Friendly Pricing
Enterprise seat-based pricing punishes lean teams. What to look for instead:
- Generous free tiers with real functionality (not artificially capped)
- Usage-based pricing that scales with actual traffic
- No forced seat minimums for small teams
- Free tiers that include alerting and multi-user access, not just basic logging
Multi-Provider Model Support
37% of enterprises now run five or more models in production — and startups experiment even more aggressively. A platform that only observes OpenAI calls gives you an incomplete picture the moment you test Anthropic or route traffic to a cheaper open-source model. Multi-provider coverage needs to be table stakes, not a premium add-on.
Cost Attribution and Spend Alerting
Running multiple models compounds cost visibility challenges. A dashboard that shows aggregate token usage tells you how much you spent — but not where, or why. Platforms that attribute costs per user, feature, or model — and alert you when spend deviates from expectations — give you the control that actually matters when you're managing inference budget tightly.
Best LLM Observability Platforms for Startups
These platforms were selected on startup-relevant criteria: setup simplicity, pricing accessibility, multi-model coverage, and observability depth available without enterprise contracts.
FastRouter
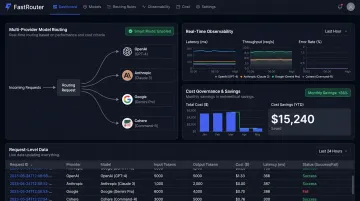
FastRouter is a full LLMOps control plane that combines multi-provider model routing, real-time observability, cost governance, guardrails, experiment tracking, and evaluations across 100+ models through a single OpenAI-compatible API.
What makes it distinctive for startups is consolidation. Instead of running a separate routing layer, a separate observability tool, and a separate evaluation workflow, FastRouter handles all three. For a small engineering team, that's not a minor convenience — it's a meaningful reduction in integration overhead and ongoing maintenance.
Setup follows the same pattern as a standard OpenAI SDK integration: install the SDK, swap the base URL to https://go.fastrouter.ai/api/v1, and requests start flowing through with full visibility immediately. No new library to learn. Internal data shows 46% average cost reduction identified through LLM audits, with $1,240 in average monthly savings surfaced per audit.
Customer feedback from production deployments reflects the multi-model value:
"Reliable access to models across providers helps remove the worry about outages or vendor lock-in." — Sainath Gupta, Founder, Knit Finance
"We use FastRouter to optimize cost vs quality balance as new models release every few weeks." — Dr. Rishabh Bhandari, Founder, Medisha
| Category | Details |
|---|---|
| Key Features | Multi-provider routing across 100+ models, real-time observability, cost governance, guardrails, experiment tracking, evaluations, OpenAI-compatible API |
| Pricing | Free credits on sign-up (no credit card required, no setup fees, no monthly minimums); visit fastrouter.ai for current plan details |
| Best For | Teams that want a unified LLMOps foundation — routing, observability, and evaluation — without stitching together multiple tools |
Langfuse
Langfuse is an open-source LLM engineering platform (MIT-licensed core) offering tracing, prompt management, evaluations, and usage analytics. It was acquired by ClickHouse in January 2026 and has one of the strongest community ecosystems in the space.
For cost-conscious, engineering-led startups, the open-source model is a genuine advantage: full data ownership at zero cost via self-hosting, no vendor dependency, and straightforward setup across most stacks.
Supported integrations include OpenAI SDK, LangChain, LlamaIndex, LangGraph, LiteLLM, Vercel AI SDK, and OpenTelemetry.
One limitation worth flagging: Langfuse doesn't include built-in evaluation metrics out of the box. Teams need to build their own scoring logic, which adds effort for startups without an ML engineering background.
| Category | Details |
|---|---|
| Key Features | OpenTelemetry-native tracing, prompt versioning and management, session tracking, cost and token dashboards, self-hosting via Docker/Kubernetes |
| Pricing | Free tier: 50K events/month, 2 users, 30-day data access. Paid from $29/month (100K units, unlimited users, 90-day retention). Self-hosting is free. |
| Best For | Engineering-led startups that want open-source tracing with full data ownership and are comfortable building their own evaluation layer |
Helicone
Helicone is a proxy-based LLM observability platform (Apache-2.0) that sits between your application and LLM providers. The integration model is deliberately minimal: change the base URL from api.openai.com to oai.helicone.ai, add authentication headers, and full request logging begins immediately.
It supports providers including OpenAI, Anthropic, Azure OpenAI, AWS Bedrock, Google AI Studio, Vertex AI, Groq, Mistral, DeepSeek, and others. Intelligent caching reduces API costs on repeated prompts, and automatic failover improves reliability without custom code.
The tradeoff: evaluation capabilities are basic, and visibility into complex agent chains is limited. Helicone is optimized for the "get observability working today" use case, not deep quality analysis.
| Category | Details |
|---|---|
| Key Features | Proxy-based integration (base URL swap only), 100+ provider/model support via AI Gateway, cost attribution, intelligent caching, auto failover, budget alerts |
| Pricing | Free tier: 10K requests/month, 1 GB storage. Pro: $79/month (unlimited seats, alerts, HQL). Self-hosting available via Docker and Helm. |
| Best For | Startups that need observability running immediately without touching application code, especially those managing multiple LLM providers |
Portkey
Portkey is an AI gateway and LLMOps platform (MIT-licensed) built around production-grade routing, automatic fallbacks, and load balancing across LLM providers. Portkey reports sub-millisecond gateway overhead, making it a common choice for startups replacing custom-built LLM management code.
Portkey's routing reliability is strong: automatic retries, fallbacks to backup models, and load balancing that would otherwise require hundreds of lines of custom code. Observability is built-in but secondary to gateway functionality. Teams needing deep evaluation or quality alerting should expect to pair Portkey with a dedicated evaluation tool.
| Category | Details |
|---|---|
| Key Features | Sub-millisecond gateway latency, automatic fallbacks and retries, load balancing, unified JS/Python SDK, request-level logging, LangChain and LlamaIndex integration |
| Pricing | Free tier: 10K logs/month. Production plan: $49/month (100K logs). Enterprise: custom pricing. |
| Best For | Startups prioritizing production routing reliability and multi-provider failover, with observability as a built-in feature |
PostHog
PostHog is an all-in-one developer platform (MIT-licensed) that combines LLM observability with product analytics, session replay, feature flags, A/B testing, and error tracking. Its AI Observability module captures LLM calls, token usage, latency, costs, prompt tokens, completion tokens, cache read/write, and time-to-first-token.
The differentiated capability here is correlation. PostHog can connect LLM performance data directly to user behavior — session replays of AI interactions, A/B test results on prompt variants, funnel analysis on AI-assisted features. No other tool on this list does that. The 100K free LLM events per month (with one-year retention) makes it genuinely accessible at early stages.
Note: prompt management and evaluations are currently in beta.
| Category | Details |
|---|---|
| Key Features | LLM call tracing, token and cost tracking, prompt management (beta), evaluations via LLM-as-a-judge (beta), session replay of AI interactions, A/B testing for prompts, product analytics integration |
| Pricing | 100K LLM observability events free/month (1-year retention); usage-based at $0.00006/event beyond that. No credit card required. |
| Best For | Product-focused startups that want LLM observability connected to user behavior data in one platform, especially those already using PostHog |
How We Chose These Platforms
The evaluation focused on startup-stage criteria, not enterprise checklist items. Common mistakes when evaluating observability tools include prioritizing GitHub stars or brand recognition without checking whether the free tier is functional or whether setup requires significant DevOps investment.
Factors evaluated:
- Integration speed — Can a solo engineer get to first logged request in a day?
- Pricing model — Is the free tier genuinely useful, or artificially limited to push upgrades?
- Multi-provider support — Coverage across the full model landscape, not just OpenAI.
- Observability depth — Does it go beyond logging to include cost attribution and quality signals?
- Growth path — Will this tool still work at 10x current traffic, or require a migration?
No single platform wins every category — the right pick depends on where your team is right now. A pre-launch team benefits from Langfuse's open-source tracing and zero-cost self-hosting. FastRouter's unified LLMOps control plane is the stronger fit for teams at scale with complex routing needs. And if your startup already runs PostHog for product analytics, you get LLM observability effectively for free.
Conclusion
For startups, the cost of skipping LLM observability isn't theoretical — it's cost overruns that don't surface until month-end billing, quality degradation that shows up first in churn data, and production failures your users find before your engineers do. The right platform depends on where your team is right now — but the time to get this in place is before you're managing three models, two providers, and a cost spike you can't explain.
Start with a generous free tier, but evaluate whether the tool grows with you. Multi-model routing, cost governance, and evaluation depth matter more as you scale — and migrating observability tooling mid-growth costs real engineering time you can't get back.
That consolidation problem is exactly what FastRouter addresses. Instead of managing separate billing, logging, and eval toolchains, you get model routing, observability, cost governance, guardrails, and evaluations through a single OpenAI-compatible endpoint. Explore FastRouter and get started with free credits — no credit card required.
Frequently Asked Questions
What is LLM observability, and why does it matter for startups?
LLM observability means monitoring AI model behavior in production — tracking inputs, outputs, latency, token costs, and quality signals across every request. For startups, it matters because silent failures, cost overruns, and quality drift are invisible without it, and there's rarely a dedicated team to catch them manually before users notice.
How is LLM observability different from traditional application monitoring?
Traditional APM tracks latency, uptime, and error rates — binary signals where something either works or doesn't. LLM observability adds a quality dimension: a model can return 200 OK in 50ms and still hallucinate, leak sensitive context, or give an irrelevant answer. That quality layer requires purpose-built tooling that APM platforms don't provide.
Do startups need LLM observability from day one?
Basic tracing should start when an LLM feature ships to real users — cost and quality issues compound quickly without visibility. Most tools on this list have free tiers that make early adoption low-risk, and the integration overhead is measured in hours, not sprints.
What should startups prioritize when choosing an LLM observability platform?
Prioritize:
- Fast integration — hours, not weeks
- Startup-friendly pricing — usage-based or generous free tiers
- Multi-provider model support across major LLM providers
- Depth beyond logging — cost attribution, routing, and foundational evaluation capabilities
How much does LLM observability cost for an early-stage startup?
Most leading tools — Langfuse, Helicone, PostHog, Portkey — offer free tiers sufficient for early-stage production traffic. Costs become meaningful at scale, and free tier limits vary between platforms, so review per-unit pricing before committing.
Can one platform handle both LLM routing and observability for a startup?
Unified LLMOps platforms like FastRouter combine multi-provider routing, observability, cost governance, and evaluations in a single control plane — eliminating the need to maintain separate tools for routing and monitoring.