Introduction
Modern AI agents are nothing like the rule-based chatbots they replaced. Today's agents autonomously chain LLM calls, invoke external tools, manage memory, and execute multi-step decisions — often without any human in the loop. As deployment scales, so does the exposure to unpredictable, costly, or non-compliant behavior.
Complexity is only half the problem. An agent given identical inputs can follow entirely different reasoning paths depending on retrieved context, tool outputs, or subtle prompt variations. When something goes wrong, traditional debugging offers little help — you can't reproduce a failure you can't see.
According to LangChain's 2025 State of Agent Engineering survey, 89% of organizations have now implemented some form of agent observability — a clear signal that the industry has stopped treating observability as optional infrastructure.
Agent observability is a core pillar of LLMOps — the operational practice of running LLMs reliably in production — and it's where teams most often lose control of reliability and cost. This article covers three concrete advantages observability delivers in production, what breaks when it's absent, and how to apply it effectively.
For teams operationalizing this, FastRouter is the LLMOps platform — one OpenAI-compatible API across 150+ models, sub-10ms overhead, zero markup, with built-in observability and cost governance.
Key Takeaways
- Observability gives teams visibility into agent reasoning, tool use, and failure points — no more guesswork in production
- Without it, agents are black boxes: costs spike, quality drifts, and debugging happens after damage is done
- Core advantages: precise failure localization, real-time cost and latency control, and systematic quality improvement
- At scale — especially in multi-agent systems — observability shifts from useful to non-negotiable
- Teams that treat it as a continuous practice ship more reliable agents, faster
What Is AI Agent Observability?
AI agent observability is the ability to see inside an agent's execution — what steps it took, what tools it called, what data it retrieved, and why it made the decisions it did — turning an otherwise opaque system into something teams can actually inspect and reason about.
This applies across the full agent lifecycle — from single-agent setups handling customer queries to complex multi-agent pipelines coordinating specialized agents across enterprise workflows. The telemetry it captures goes well beyond traditional application performance monitoring.
MELT Data vs. Standard APM
Standard APM tracks infrastructure: server CPU, request latency, error rates. AI agent observability instruments an entirely different layer:
| Traditional APM | AI Agent Observability |
|---|---|
| Server and service metrics | Token usage per LLM call |
| HTTP request/response logs | Tool invocation sequences |
| Error codes and stack traces | Reasoning transitions between steps |
| Latency by endpoint | Retrieval step quality and relevance |
| Resource consumption | Agent path convergence and loop detection |
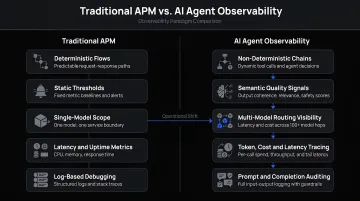
Together, these signals — Metrics, Events, Logs, and Traces (MELT) — give teams the instrumentation needed to debug failures, control costs, and evaluate quality systematically.
Observability isn't an end in itself. It's the foundation that makes everything else operational: pinpointing exactly which tool call silently failed, catching runaway token costs before they compound, and producing the audit trail that compliance reviews actually require. That foundation has to be in place before any of those problems become solvable.
Three Core Advantages of Observability for AI Agents
AI agent observability must account for non-determinism in ways standard software observability doesn't. The same agent can follow different paths on identical inputs. Tool calls return variable results. Reasoning shifts based on retrieved context. These properties make trace-level visibility the only reliable mechanism for understanding production behavior.
Advantage 1: Precise Failure Localization and Root Cause Debugging
The problem: A multi-step agent that hallucinates a tool parameter or enters a reasoning loop can produce a plausible-looking final output. Without traces, the failure is invisible until enough users complain to surface it.
How observability solves it: By capturing structured traces of every LLM call, tool invocation, retrieval step, and reasoning transition, teams can replay the exact execution path of a failed request — including the original context, model inputs, and intermediate outputs — instead of guessing from the final answer alone.
A 2026 arXiv fault taxonomy that analyzed 13,602 issues and pull requests from 40 open-source agentic AI repositories found that the leading failure categories included:
- Dependency and Integration Failures (19.5% of studied faults)
- Data and Type Handling Failures (17.6%)
- LLM Behavior and Interface Changes (13.1%)
- Tooling faults including API misuse, parameter mismatch, and hallucinated API parameters
- Semantic failures where outputs are structurally valid but factually wrong — and can propagate silently through reasoning chains
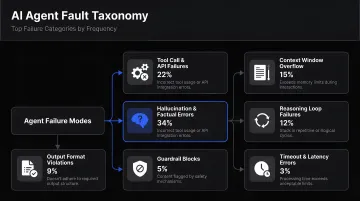
That last category is particularly dangerous. An agent that confidently returns a wrong answer, formatted correctly, gives no external signal that anything failed. Step-level traces surface these silent failures before they accumulate into user-reported incidents.
In multi-agent systems, this matters even more. A failure in one agent can cascade across agent boundaries — downstream agents receive bad inputs, amplify errors, and produce compounded failures. Tracing captures inter-agent handoffs, making the propagation path visible and containable.
KPIs this improves: Mean time to resolution (MTTR), error rate per agent step, failure localization time, regression frequency after deployments.
When it matters most: Production multi-agent systems, pipelines with 3+ tool calls per request, and any scenario where someone other than the original builder needs to diagnose a failure.
Advantage 2: Real-Time Cost and Latency Control
The problem: AI agents autonomously decide how many LLM calls, API requests, and retrieval steps to make. A single runaway execution can incur unpredictable costs. Without per-step visibility, teams discover token overruns in billing cycles — not during execution.
How observability solves it: By attributing token consumption and latency to each individual step in a trace, teams can identify exactly which sub-task consumes the most tokens, which tool call adds the most latency, and which agent paths trigger unnecessary loops.
This is more than a debugging convenience — it's a financial control mechanism. As a16z's 2025 analysis of over 100 trillion real-world LLM tokens shows, agentic inference is the fastest-growing behavior on major platforms, characterized by longer prompts and more turns per task. That growth pattern means cost exposure scales non-linearly with deployment volume.
Langfuse's data makes the cost dynamic concrete: higher accuracy in agentic workflows often comes from calling models multiple times and selecting the best answer — a pattern that compounds operational costs if left unmonitored.
Per-step cost attribution changes what's possible:
- A team discovers one retrieval query consumes 10x the tokens of all others → targeted fix reduces costs without touching anything else
- Real-time alerts catch a runaway reasoning loop before it compounds across thousands of requests
- Routing decisions can be informed by observability data — selecting lower-cost models for steps where precision requirements are lower
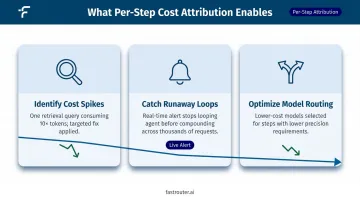
FastRouter's cost governance features address this directly: real-time spend alerts, project and API key limits, and consolidated multi-provider billing across OpenAI, Anthropic, Gemini, Grok, and others — all surfaced through unified dashboards that flag anomalies before they become billing events.
KPIs this improves: Token cost per trace, average latency per agent step, API call efficiency ratio, path convergence score.
When it matters most: High-volume production deployments, multi-agent pipelines where each agent spawns its own LLM calls, and cost-sensitive contexts where per-request economics must stay predictable.
Advantage 3: Systematic Quality Improvement and Compliance Assurance
Response quality in AI agents degrades silently. A model that performs well on initial test cases can drift as real-world inputs evolve — and without continuous evaluation, teams don't discover the erosion until users report it, often long after the causal data is recoverable.
Capturing a structured record of every agent decision, tool selection, and output gives teams the foundation to:
- Run automated evaluations (LLM-as-a-judge or code-based checks) against production traces
- Build regression datasets from real production failures
- Track output distribution shifts over time as early indicators of model drift
- Generate audit trails that satisfy compliance requirements
The evaluation gap is real. LangChain's survey found observability adoption at 89%, but offline evaluations at only 52.4% and online evaluations at 37.3%. Most teams are collecting traces — fewer are closing the loop from traces to systematic quality feedback.
For regulated industries, the compliance dimension is non-negotiable. EU AI Act Article 12 requires high-risk AI systems to technically allow automatic recording of events over their lifetime for traceability and post-market monitoring. Observability's logs and traces are the evidentiary record that satisfies this requirement — without them, organizations face real legal exposure. The SEC's 2024 enforcement action charging two investment advisers with AI-related disclosure violations, resulting in $400,000 in civil penalties, illustrates that AI governance failures carry concrete financial consequences.
FastRouter's Guardrails service catches policy violations, unsafe content, and malformed responses before they reach users — and logs every intervention, making guardrail actions traceable within the broader observability framework. Combined with PII masking and data-residency controls, this supports compliance workflows in healthcare and fintech environments.
KPIs this improves: Response quality score, hallucination rate, goal completion rate, compliance audit pass rate, model drift indicators.
When it matters most: Customer-facing agents where quality erosion affects trust, regulated industries requiring AI decision auditability, and teams iterating rapidly on prompts or models who need regression testing.
What Happens When Observability Is Missing
Teams that skip observability infrastructure don't avoid the problems — they just encounter them later, with less information to act on.
The operational consequences are predictable:
- Failures stay invisible until users report them. Semantic failures — where output looks correct but isn't — generate no alerts, no error codes, and no stack traces. Only traces reveal them.
- Costs spiral unpredictably. Token overruns surface in billing statements, not during execution. Without per-step attribution, targeted optimization is impossible.
- Quality degradation accumulates. Model drift, declining retrieval relevance, and rising hallucination rates go undetected until they're critical. At that point, the absence of historical trace data makes root cause analysis nearly impossible.
- Scaling amplifies hidden problems. A system that works at 10 daily requests may break systemically at 1,000. Without observability, teams can't identify failure modes that only emerge at volume before users experience them.
- Compliance exposure grows silently. In regulated environments, operating AI agents without a verifiable decision audit trail creates legal and reputational risk that materializes without warning.
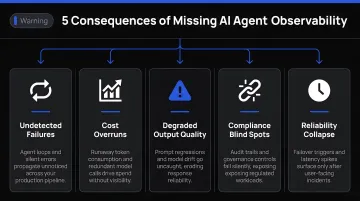
Gartner predicts over 40% of agentic AI projects will be canceled by end-2027 due to escalating costs, unclear business value, and inadequate risk controls. Each of those failure modes is directly traceable to running agents blind — without the visibility needed to catch cost overruns, measure quality, or defend decisions.
How to Get the Most Value from AI Agent Observability
Observability delivers full value when treated as a continuous operational practice — built into daily workflows, not pulled out during incidents. Three practices make the difference:
1. Instrument Before You Optimize
Capture LLM calls, tool invocations, retrieval steps, reasoning transitions, and state changes as structured traces from the start. For teams using platforms with pre-built agent integrations and dashboards, setup can be minimal — but the habit of instrumenting comprehensively before optimizing is what matters.
FastRouter's LLMOps platform provides unified dashboards, activity logs, real-time alerts, and ongoing evaluations, removing the need to build reporting infrastructure from scratch. Failover events, routing decisions, and provider-level performance are all captured as distinct, traceable events — and the same platform covers model routing, experiment tracking, guardrails, and cost governance, so observability feeds directly into continuous improvement across the full LLM lifecycle.
2. Close the Loop from Traces to Improvements
Production traces are only useful if they feed back into the development cycle:
- Convert production failures into regression test datasets
- Run automated evaluations on sampled live traffic (LLM-as-a-judge for nuanced quality, code-based checks for objective criteria)
- Use evaluation results to drive targeted changes to prompts, tools, and retrieval configurations
FastRouter's Evaluations and Experiment Tracking services support this loop — enabling A/B testing across models and configurations, with quality, cost, and latency comparisons to inform decisions systematically.
3. Review on a Cadence, Not Just During Incidents
Establish regular reviews of quality metrics, cost trends, and latency patterns. Treat observability data as an input to sprint planning and release decisions — not just an emergency diagnostic tool. Teams that schedule weekly or bi-weekly observability reviews consistently catch degradation earlier, cut remediation costs, and ship improvements with more confidence.
Conclusion
AI agents operate autonomously across complex, multi-step workflows. That autonomy is what makes observability the primary mechanism for maintaining control — and it's why observability sits at the center of every mature LLMOps practice, built into how agents are engineered, not bolted on after problems surface.
The three advantages — precise failure localization, real-time cost control, and systematic quality improvement — don't exist in isolation. Each reinforces the others: production traces become raw material for agent refinement, faster debugging reduces incident frequency, better cost visibility informs routing decisions, and systematic evaluation catches quality regressions before users encounter them.
The practical mindset shift: treat observability as an engineering practice embedded in how agents are built, deployed, and iterated on. Teams that build observability in from the start ship more reliable agents — and spend less time firefighting when something breaks in production.
Frequently Asked Questions
What is agentic observability?
Agentic observability makes AI agent behavior fully visible and traceable — capturing every step, tool invocation, data retrieval, and reasoning progression. It gives teams the instrumentation needed to debug, evaluate, and improve agent systems in production, not just inspect final outputs.
Why is observability important in AI?
AI systems, especially agents, are non-deterministic — identical inputs can produce different outputs depending on context, retrieved data, and model state. Traditional debugging assumes reproducibility; observability provides the structured traces, metrics, and logs needed to understand failures and maintain quality when that assumption doesn't hold.
What are the four pillars of agentic AI?
The four core components of an agentic AI system are:
- Language model — the reasoning engine
- Planning module — breaks tasks into sub-steps
- Tool/action module — interacts with external systems and APIs
- Memory module — stores context across interactions
Observability spans all four, making each layer inspectable in production.
What is the difference between observability and monitoring for AI agents?
Monitoring tracks predefined metrics and alerts when thresholds are breached. Observability is broader — it's the ability to ask and answer any question about an agent's internal state using traces, logs, and metrics together. Monitoring tells you something went wrong; observability helps you understand why and where.
How does observability help with AI agent cost management?
Per-step token attribution exposes exactly which agent steps, tool calls, or reasoning loops are driving excess costs. Teams can then make targeted optimizations — adjusting specific retrieval queries, capping loop iterations, or routing certain steps to lower-cost models — rather than applying blunt budget controls at the model level.
What data does AI agent observability collect?
The four telemetry types (MELT): Metrics (token usage, latency, error rates), Events (tool invocations, API calls, human handoffs), Logs (LLM interactions, decision records, tool execution outputs), and Traces (the end-to-end journey of a request through every agent step and tool call).