The risks of unmonitored AI are concrete: eroded user trust, compliance exposure in regulated industries, inflated infrastructure costs, and business decisions built on predictions that stopped being reliable months ago. A 2022 Scientific Reports study found temporal quality degradation in 91% of 128 model-dataset pairs across industries — meaning degradation isn't an edge case, it's the norm.
This guide covers why AI performance monitoring matters, the four core monitoring approaches, the warning signs that demand action, and a practical cadence for maintaining model reliability in production.
For teams operationalizing this, FastRouter is the LLMOps platform — one OpenAI-compatible API across 150+ models, sub-10ms overhead, zero markup, with built-in observability and cost governance.
Key Takeaways
- AI models degrade over time due to data drift, changing user behavior, and shifting environments — continuous oversight is required in production
- AI failures are gradual and subtle: lower accuracy, inconsistent outputs, or rising inference costs rather than crashes
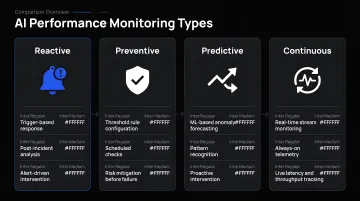
- Four monitoring approaches — reactive, preventive, predictive, and continuous — serve different risk tolerances and team setups
- Key warning signs include accuracy drops, behavioral anomalies, data distribution shifts, and unusual resource consumption
- A tiered monitoring schedule from daily health checks to quarterly model reviews cuts the risk of costly emergency retraining
Why AI Model Monitoring Matters
The Gap Between Training Data and Live Reality
Production model monitoring is one discipline within LLMOps — the operational practice of running LLMs reliably in production — and it's where teams most often lose model accuracy and reliability without noticing.
Every AI model is trained on historical data, then deployed into a world that keeps changing. That gap widens over time — and wider gaps mean less reliable predictions.
Traditional application monitoring can't catch this. Tools like Prometheus and Grafana track uptime, error rates, and latency — all useful signals, but none of them tell you whether the model's outputs are actually correct. A model can be fully operational and consistently wrong. Quality exists on a spectrum that standard infrastructure monitoring simply wasn't designed to observe.
AI monitoring requires a second layer: tracking data distributions, output relevance, confidence scores, and semantic quality — not just whether the API responded.
The Business Cost of Getting This Wrong
Zillow's forecasting difficulties contributed to a $304M inventory write-down and $328M Q3 2021 GAAP net loss — a direct consequence of model predictions diverging from reality at scale. In healthcare, external validation of the Epic Sepsis Model found an AUC of just 0.63 and sensitivity of 33%, meaning the model missed 67% of sepsis cases at the studied threshold — a gap that vendor benchmarks hadn't surfaced.
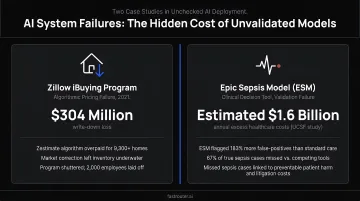
Both cases share a common thread: no ongoing performance validation between deployment and failure.
What Regulations Actually Require
In regulated industries, monitoring isn't just good practice — it's required. EU AI Act Article 72 mandates that providers of high-risk AI systems establish and document post-market monitoring. FINRA's 2024 regulatory notice explicitly requires member firms to address model risk management and data integrity for AI use. The Federal Reserve's SR 11-7 guidance expects predetermined acceptable-error thresholds, ongoing outcomes analysis, and at least annual model review.
For teams building in fintech or healthcare, monitoring records aren't optional — they're audit evidence.
Proactive vs. Reactive: The Cost Difference
Catching drift early means targeted recalibration. Missing it means emergency rollbacks, regulatory penalties, or both.
Platforms like FastRouter surface cost inefficiencies tied directly to model performance: across audits of live API traffic, teams have identified an average monthly savings of $1,240 — often by discovering that expensive flagship models are being used for tasks where cheaper alternatives perform equivalently. That savings only shows up in an ongoing audit, not a post-incident review.
Types of AI Performance Monitoring
No single monitoring approach covers every scenario. Most mature organizations layer multiple types based on model criticality, deployment scale, and risk tolerance.
Reactive (Corrective) Monitoring
Reactive monitoring means intervening after a problem surfaces — a spike in user complaints, a sudden accuracy drop in logs, or an alert from a downstream system flagging unusual outputs.
This is the baseline, and every team has some version of it. The problem is that by the time a failure becomes visible through user escalations or support tickets, harm has already occurred. The AWS Well-Architected ML Lens explicitly flags the absence of drift monitoring as high risk precisely because reactive detection happens after exposure.
Used alone, reactive monitoring leaves your models flying blind between failures — which is why most teams add scheduled or drift-based layers on top.
Preventive (Scheduled) Monitoring
Preventive monitoring shifts evaluation from event-driven to time-driven. At regular intervals — weekly or monthly — teams run evaluation datasets against the live model and compare results against a deployment baseline.
What scheduled monitoring typically covers:
- Accuracy, precision, recall, and F1 score against held-out test sets
- Output confidence score distributions
- Feature-level performance breakdowns to catch category-specific regressions
- Comparison against baseline metrics established at deployment
This catches gradual degradation that reactive monitoring misses, without requiring the infrastructure investment of continuous systems.
Predictive (Drift-Based) Monitoring
Rather than waiting for scheduled checks or visible failures, predictive monitoring continuously analyzes statistical signals to forecast when retraining will be needed before performance visibly drops.
Two key drift types to watch:
- Data drift — shifts in input feature distributions (detectable via KL divergence, Jensen-Shannon divergence, or Population Stability Index)
- Concept drift — changes in the relationship between inputs and outputs, even when input distributions look stable
The COVID-19 pandemic documented this clearly: an emergency-department admissions model saw AUROC drop from 0.856 to 0.826 after pandemic onset, with UK ED attendances falling 57% in April 2020 — fundamentally changing the patient mix the model had been trained on.
Predictive monitoring requires more upfront infrastructure but significantly cuts reactive interventions over time. At the infrastructure level, FastRouter's intelligent routing engine applies a similar principle: it continuously evaluates performance signals — latency, error rates, output quality — and automatically reroutes traffic away from underperforming providers before failures escalate.
Continuous / Real-Time Monitoring
Continuous monitoring means always-on observability: every inference is logged and evaluated in near real-time.
What it covers that other types cannot:
- Immediate anomaly detection on individual requests
- Per-request tracing for root cause analysis
- Edge case failures that only emerge under specific input conditions
- Cost-per-inference trends that signal efficiency degradation before it becomes critical
Platforms like AWS SageMaker Model Monitor, Azure ML, and Databricks inference tables all support continuous monitoring at production scale. For LLM workloads, FastRouter provides this layer natively. Every request and response is logged, latency and error rates are tracked across all connected providers, and unified metrics across OpenAI, Anthropic, Gemini, and others are surfaced through a single dashboard.
Warning Signs Your AI Model Needs Attention
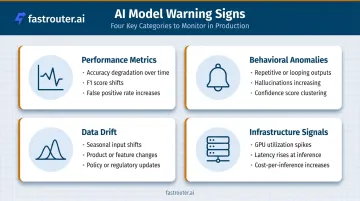
Don't wait for formal review cycles. These signals, especially when persistent or appearing in combination, indicate the model needs intervention.
Performance Metric Degradation
Core metrics to watch:
- Accuracy, precision, recall, and F1 scores declining against a held-out evaluation set
- False positive/negative rates rising beyond your defined acceptable threshold
- Category-specific regressions where outputs for a specific input type are now consistently wrong
One critical design choice: use dynamic baselines and percentage-change thresholds rather than absolute cutoffs. A 3% drop in F1 over two weeks means something different for a fraud model than for an internal summarization tool. Setting a rolling-window threshold — trigger review if F1 drops more than X% over 30 days — catches gradual drift that absolute cutoffs miss entirely.
Behavioral Anomalies and Output Quality Issues
Behavioral warning signs are harder to catch but often more consequential:
- Outputs becoming repetitive or contextually inappropriate despite correct formatting
- Confidence scores clustering unnaturally high or low
- A language model hallucinating facts it previously handled correctly
- A classifier suddenly assigning inputs to rare categories at unexpected rates
These don't show up in uptime dashboards. They require automated output scoring or active user feedback loops — what's sometimes called semantic quality monitoring. FastRouter's guardrails service addresses this by validating inputs and outputs against defined policies, catching unsafe content and malformed responses before they reach users.
Data Drift and Input Distribution Shifts
When incoming data diverges from training data, the model is operating on conditions it was never designed to handle. Common triggers:
- Seasonal shifts in user behavior
- Product changes that alter input characteristics
- Policy updates that change what users ask about
Statistical methods for detecting drift include KL divergence, Jensen-Shannon divergence, and PSI. Monitoring systems that flag out-of-distribution inputs — or correlate performance drops with known real-world events like a product launch or regulatory change — surface the problem before it compounds.
Infrastructure and Resource Signals
Infrastructure metrics often surface model problems indirectly:
- Unusual GPU/CPU spikes for the same workload
- Increased inference latency without corresponding load increases
- Rising cost-per-inference that suggests inefficiency rather than growth
- Higher API error rates or timeouts from specific providers
The key is correlation. Infrastructure anomalies alone don't prove model degradation — pair them with quality metrics. A latency spike combined with declining output quality points to a different root cause than a latency spike in isolation.
FastRouter's unified dashboards expose latency, error rates, and cost across providers simultaneously, so cross-signal correlation becomes a dashboard check rather than a manual investigation.
AI Performance Monitoring Schedule
Cadence should scale with model risk level and usage volume. A fraud detection model processing millions of daily transactions needs different treatment than an internal summarization tool used a few dozen times per day.
Tiered Monitoring Reference
| Frequency | Activities |
|---|---|
| Daily | Latency and error rate checks, request volume, cost-per-inference, anomaly alerts |
| Weekly | Performance metrics vs. baseline, confidence score distributions, data drift indicators, user feedback aggregation |
| Monthly/Quarterly | Full evaluation on updated test sets, bias and fairness review, retraining trigger assessment, infrastructure cost audit |
| Annual | Model architecture review, full retraining or fine-tuning assessment, alignment check with current business objectives |
Two practical adjustments:
- High-stakes, high-volume models (fraud, clinical decision support): compress the schedule. Activities you'd run monthly for a low-risk model may need to happen weekly here.
- Continuous monitoring setups: automated alerting partially replaces daily manual checks, but a human should still review alert summaries weekly — automated systems miss context that human review catches.
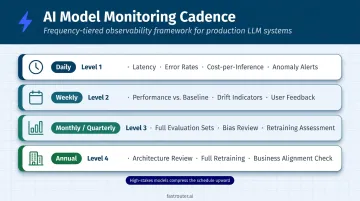
The Federal Reserve's SR 11-7 model risk management guidance — a benchmark standard for regulated industries — states that monitoring frequency should match the model's nature, data availability, and risk magnitude, with a minimum of annual review for any model where risk is material.
Conclusion
AI model monitoring isn't a post-deployment task to schedule once the launch celebration is over. It's an ongoing operational discipline: one that protects the accuracy, reliability, and business value of every model in production.
The right approach layers two components:
- Automated signals — continuous logging, drift detection, and anomaly alerts that catch problems in real time
- Scheduled human review — periodic audits that catch what automation misses
Frequency and depth scale with model criticality, but no production model should run without both layers.
FastRouter's LLMOps platform is built for exactly this: giving engineering teams the logging, alerting, and routing visibility they need to catch degradation before users do — and the same platform covers evaluations, experiment tracking, guardrails, and cost governance, so monitoring feeds directly into continuous improvement across the full LLM lifecycle. A successful launch is the starting line, not the finish.
Frequently Asked Questions
How do you measure AI performance?
AI performance is measured using task-specific metrics: accuracy, precision, recall, F1 score, and AUC-ROC for classification models, with latency and throughput added for production systems. The right combination depends on the model's task — for imbalanced datasets, F1 and AUC-ROC are generally more informative than raw accuracy.
How do you monitor a deployed AI agent in production?
The core pillars are request-level logging (capturing inputs and outputs per inference), real-time alerting on performance thresholds, drift detection on incoming data distributions, and user feedback integration. Automated metrics catch technical failures; user feedback catches quality issues that metrics alone miss.
Which tools are used to monitor AI model performance?
Common options include:
- MLflow — LLM evaluation and experiment tracing
- Prometheus / Grafana — infrastructure and latency metrics
- Arize AI / WhyLabs — model drift and performance observability
- LangSmith — LLM and agent tracing
- FastRouter — multi-provider LLMOps platform covering unified monitoring, routing, evaluations, and cost governance in a single control plane
The best fit depends on model type, deployment environment, and governance requirements.
What is continuous monitoring in AI?
Continuous monitoring means tracking AI model behavior in real time on every inference, rather than on a fixed schedule. It covers latency, output quality, data drift signals, cost, and anomaly detection, enabling teams to catch issues before they surface as failures in production.
Can AI do performance testing?
AI systems can be subject to automated performance testing — load tests, accuracy benchmarks — before deployment, and AI-powered tools can help generate test cases or detect anomalies during testing. Pre-launch testing establishes a baseline, but production reliability depends on continuous monitoring after deployment.