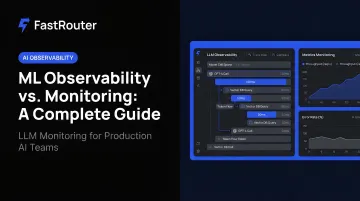
This creates two distinct problems. The first is detection — knowing something is wrong. The second is diagnosis — understanding why it's wrong. ML monitoring and ML observability are both disciplines within LLMOps — the operational practice of running LLMs reliably in production — and each solves one of these problems. Treating them as interchangeable leaves critical gaps in your production AI stack.
The distinction matters more than ever. As LLMs, agentic workflows, and multi-modal systems push AI into higher-stakes applications, the gap between what a metric dashboard tells you and what you actually need to know is growing. This guide covers clear definitions, a structured comparison, and practical guidance on when to use each — and how to combine them.
For teams operationalizing this, FastRouter is the LLMOps platform — one OpenAI-compatible API across 150+ models, sub-10ms overhead, zero markup, with built-in observability and cost governance.
Key Takeaways
- ML monitoring is reactive — it tracks predefined metrics and fires alerts when thresholds are breached
- ML observability is proactive — it uses logs, traces, metrics, and explainability tools to diagnose why issues occur
- Monitoring answers "what" and "where"; observability answers "why" and "how"
- The two complement each other — monitoring is Layer 1, observability is Layer 2
- Simple, early-stage models can start with monitoring; complex or regulated AI systems need full observability
ML Observability vs. ML Monitoring: Quick Comparison
| Dimension | ML Monitoring | ML Observability |
|---|---|---|
| Primary Question | Is something wrong? | Why is it wrong? |
| Approach | Reactive, threshold-driven | Proactive, investigative |
| Scope | Model metrics | Full system: data, code, infra, model |
| Key Capabilities | Drift detection, accuracy tracking, alerts | Logs, traces, XAI, root-cause analysis |
| Output | Alerts and dashboards | Diagnostic insights and audit trails |
| Ideal Use Case | Simpler models, early MLOps maturity | LLMs, regulated industries, agentic AI |
Neither replaces the other. Most production teams need both — monitoring to catch problems fast, observability to understand why they happened and prevent recurrence.
What Is ML Monitoring?
ML monitoring is the continuous tracking of predefined metrics to detect when a model's behavior deviates from expected thresholds. It's primarily reactive — when a metric exceeds a threshold, an alert fires.
Two Levels of ML Monitoring
Model-level monitoring tracks predictive performance:
- Accuracy, precision, recall, F1 score, AUC-ROC
- Prediction drift — shifts in the distribution of model outputs
- Outlier detection and data quality signals
System-level monitoring tracks operational health:
- Latency, throughput, and error rates
- Resource utilization and infrastructure stability
- Token consumption for LLM workloads
Arize defines ML monitoring as techniques used to measure key model performance metrics and understand when production issues arise — with model drift, performance, outliers, and data quality as the primary focus areas.
Why Drift Is the Core Signal
Two drift types cause the most silent damage in production:
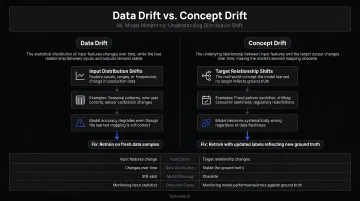
- Data drift (covariate shift): Input feature distributions shift while the model's learned relationships stay fixed. A credit-scoring model trained on pre-2022 consumer behavior, for instance, may perform poorly against post-inflation spending patterns.
- Concept drift: The relationship between inputs and outputs changes as real-world behavior evolves beyond what the training data captured.
IBM notes that model accuracy can degrade within days of deployment due to these changes. Fiddler's research suggests 91% of ML models degrade over time (vendor-cited; treat as directional).
What Monitoring Cannot Do and When It's Enough
Monitoring surfaces the symptom, not the cause. A precision drop tells you something is wrong — not whether the culprit is upstream data quality, a labeling error, infrastructure latency, or a real-world shift. Diagnosing that requires observability.
Monitoring is often sufficient when:
- Models are well-defined and low-complexity (tabular classifiers, rule-augmented systems)
- Deployments are early-stage with limited production traffic
- The team is early in MLOps maturity and needs fast dashboard deployment
- Failure modes are known and can be captured with a fixed metric set
Example: A fraud detection model tracked via precision/recall dashboards and drift alerts. The team can see when scores drop — but still needs to investigate separately to determine whether the cause is feature drift, class imbalance shift, or data pipeline issues.
What Is ML Observability?
ML observability is end-to-end visibility into an ML system's behavior — not just what metrics indicate, but why a model produces a particular output. It extends the scope of monitoring to include input data, infrastructure, code paths, and model explainability.
The Three Pillars — Extended for AI
Traditional observability rests on logs, traces, and metrics. For ML and generative AI systems, each pillar carries additional weight:
- Logs: Granular, timestamped records of model events, decisions, and inputs/outputs — including full prompt-response pairs for LLMs
- Traces: End-to-end visibility into the journey of a request — LLM calls, tool invocations, agent decisions, and cross-service dependencies
- Metrics: Performance measurements over time, extended for AI to include token consumption, response quality scores, hallucination frequency, and groundedness
Microsoft Foundry describes GenAI observability as collecting evaluation metrics, logs, traces, and model outputs to gain visibility into performance, quality, safety, and operational health.
Explainability: What Monitoring Alone Can't Tell You
Explainability (XAI) answers why a model made a specific decision — the capability that separates observability from monitoring. Three levels matter in practice:
- Global explainability — feature importance aggregated across all predictions; useful for understanding model behavior at scale
- Cohort explainability — behavior patterns on specific subgroups; critical for bias and fairness audits
- Local explainability — why the model made a specific decision in a specific context; essential for regulated use cases
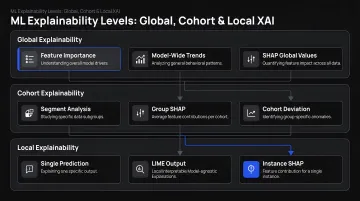
For standard ML, techniques like SHAP and LIME provide feature attribution. For LLMs, gradient-based attributions, attention analysis, and counterfactual prompts (as recommended by NIST AI 600-1) extend these methods to generative outputs.
Where Observability Becomes Non-Negotiable
Three scenarios demand full observability:
- Complex models: LLMs, computer vision systems, and multi-modal architectures produce outputs that metric dashboards alone cannot diagnose
- Regulated industries: Financial services, healthcare, and other compliance-heavy verticals require audit trails, bias detection, and adverse-action explainability
- Agentic AI: Multi-step agent workflows involve tool calls, retrieval, reasoning chains, and model-to-model handoffs, all of which require tracing to diagnose failures
The visibility gap in agentic AI is already measurable. The IBM Institute for Business Value reports that 45% of executives cite lack of visibility into agent decision-making processes as a significant implementation barrier.
Use Cases for Full Observability
LLM customer service tools: When an LLM-powered support agent produces inconsistent or hallucinated responses, observability gives teams the tools to diagnose root cause — not just surface symptoms. A typical investigation might involve:
- Tracing prompt-to-response paths for failed interactions
- Reviewing token usage patterns for anomalies
- Identifying which prompt types consistently trigger failures
- Determining whether the root cause is data quality, model drift, or infrastructure latency
The same diagnostic need applies across industries:
- Financial services — bias audits, ECOA-compliant adverse-action explanations, model risk management
- Healthcare AI — error tracing for safety-critical decisions, FDA AI/ML SaMD transparency requirements
- Enterprise AI platforms — managing hundreds of models with varying risk profiles demands systematic root-cause capability
ML Observability vs. ML Monitoring: Which Do You Need?
Monitoring and observability aren't competing choices — they operate at different layers. Monitoring is Layer 1 (early warning); observability is Layer 2 (investigation and diagnosis). Most production teams need both, but the balance depends on where you are and what you're building.
Choose Monitoring If...
- Your models are simpler and well-defined
- Your team is early in MLOps maturity
- You need fast deployment of dashboards and alerts
- Your primary concern is tracking known failure modes on a fixed metric set
Choose Observability If...
- Your models are complex — LLMs, deep learning, multi-modal, or agentic
- You're running production systems with significant user traffic
- Your industry requires compliance, auditability, or explainability
- Alerts fire regularly but your team can't diagnose the underlying cause
Layering Both Together in Practice
The most effective approach combines both:
- Establish monitoring baselines — deploy metric tracking and drift alerts first to define normal behavior
- Layer in logging and tracing: add full request-response logs and end-to-end traces to support investigation when alerts fire
- Add explainability tooling: connect XAI methods to enable root-cause analysis at the feature and decision level
- Unify into a single operational view — platforms that consolidate monitoring and observability give engineering teams one place to triage, investigate, and resolve incidents
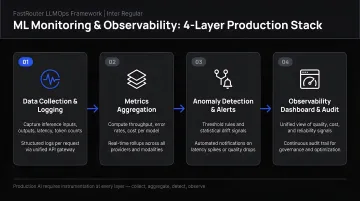
That last step is where purpose-built tooling pays off. FastRouter approaches observability and monitoring as part of a broader LLMOps platform — a single OpenAI-compatible gateway that unifies multi-provider monitoring, evaluations, experiment tracking, routing, guardrails, and cost governance across 150+ models. It captures token usage, latency (p50/p99 percentiles), error rates, and complete request-response logs across every model and provider in a single view.
When automatic failover reroutes traffic due to a provider failure, the activity log captures the event and timestamps it — creating a traceable record that supports both incident response and compliance audits.
Decision Framework
Ask these five questions to determine your approach:
| Question | Monitoring Sufficient | Observability Required |
|---|---|---|
| Model complexity | Tabular, simple NLP | LLMs, agents, multi-modal |
| Risk level | Low-stakes, internal tools | Customer-facing, safety-critical |
| Regulatory requirements | None | Financial services, healthcare |
| Team MLOps maturity | Early stage | Production scale |
| Failure diagnosis needs | Known failure modes | Unknown or complex root causes |
Conclusion
ML monitoring and ML observability operate at different depths and answer different questions. Monitoring tells you something broke; observability tells you why. Teams that stop at monitoring will find themselves blind when complex failures emerge — observability is what gives you the diagnostic power to build more reliable, trustworthy AI systems.
The business case is concrete: faster issue resolution, reduced model downtime, regulatory compliance, and maintained user trust all depend on having the right visibility strategy in place. Start with monitoring to establish baselines and alerting, then build toward full observability as your models and risk profile demand it.
For teams building on LLMs and multi-provider AI infrastructure, FastRouter offers a natural starting point: unified monitoring and observability across all connected models and providers, with free credits available to evaluate it against your own workloads.
Frequently Asked Questions
What is the difference between ML monitoring and ML observability?
ML monitoring is reactive : it tracks predefined metrics and fires alerts when thresholds are breached. ML observability is broader and proactive, using logs, traces, metrics, and explainability signals to explain why an issue occurred, enabling root-cause analysis rather than just symptom detection.
What are the pillars of AI observability?
The three traditional pillars are logs, traces, and metrics. For AI systems, these extend to include AI-specific signals:
- Token usage and cost tracking
- Model drift indicators and response quality scores
- Hallucination frequency and groundedness metrics
- Tool-call accuracy for agentic workflows
What are the best AI observability tools?
Leading platforms include Fiddler, Dynatrace, Arize AI, WhyLabs, and Evidently AI. For multi-provider LLM workloads, FastRouter provides the multi-provider LLMOps observability layer — unified dashboards, request logging, and real-time alerts that also cover routing, evaluations, and cost governance from a single control plane. The best fit depends on whether your team manages traditional ML models, LLMs, or agentic AI systems — each platform has distinct strengths across those use cases.
Can ML monitoring and ML observability be used together?
They work best together. Monitoring provides alerting and metric dashboards as the early warning layer, while observability adds the diagnostic capability needed to investigate and resolve the root cause of issues that monitoring surfaces.
What metrics does ML monitoring typically track?
Common metrics include:
- Model accuracy, precision, recall, F1 score, and AUC-ROC
- Data drift indicators, prediction latency, throughput, and error rates
The right set depends on model type. LLM workloads add token consumption and response quality; classification models prioritize precision/recall.
Why is ML observability critical for LLMs and generative AI?
LLMs produce probabilistic outputs without a single ground truth, making threshold-based monitoring insufficient on its own. Observability adds prompt-to-response tracing, token usage analysis, and hallucination detection, giving teams actionable insight into why specific outputs failed.