Gartner reports that at least 50% of GenAI projects were abandoned after proof of concept, with escalating costs and inadequate risk controls among the top reasons. Without the right observability layer, you're flying blind on exactly the issues that kill production AI systems.
Open-source LLM observability tools address this gap with full data ownership, self-hosting flexibility, and no vendor lock-in — critical for teams with compliance requirements or high trace volumes that would make hosted-only tools expensive.
This guide covers five tools worth serious consideration, with accurate pricing, license details, and honest tradeoffs.
Key Takeaways
- LLM observability tracks output quality, token costs, and agent behavior — not just latency and uptime
- MIT and Apache 2.0 licenses are commercially safe; Elastic License 2.0 (Arize Phoenix) restricts managed-service use
- Langfuse leads on breadth of features, Phoenix on RAG debugging, and Helicone on setup speed
- OpenLLMetry slots into existing stacks without replacing them; Opik adds native prompt optimization and guardrails
- Teams needing routing, cost governance, and guardrails alongside observability should evaluate a unified LLMOps platform
What Is LLM Observability?
LLM observability is the practice of monitoring, tracing, and evaluating every layer of an AI application — from the prompt sent to the response returned — including intermediate steps like tool calls, retrieval chunks, and agent reasoning chains.
Traditional APM covers crashes, latency spikes, and uptime — and that coverage still matters. But it doesn't go far enough. An LLM call can return HTTP 200, complete in 800ms, and still be factually wrong, unsafe, or completely off-topic. Without deeper instrumentation, teams have no way to know whether a 45-second response was caused by the model, a slow tool call, or a retry loop.
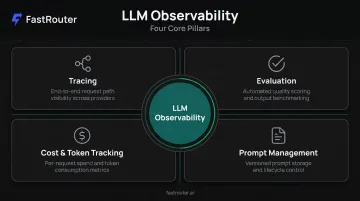
Four Core Components
Every mature LLM observability tool should cover:
- Tracing: full request lifecycle visibility, including nested agent steps and tool invocations
- Evaluation: output quality scoring (hallucination detection, relevance, faithfulness)
- Cost and token tracking: per model, user, session, and request
- Prompt management: versioning, deployment, and iteration without full redeployment
License Types and What They Mean
| License | Commercial Use | Key Restriction |
|---|---|---|
| MIT | ✅ Fully permissive | Copyright notice required |
| Apache 2.0 | ✅ Fully permissive | Includes explicit patent grant |
| Elastic License 2.0 | ⚠️ Restricted | Cannot offer software as a managed service |
MIT and Apache 2.0 are safe for any commercial deployment. Elastic License 2.0, used by Arize Phoenix, restricts certain commercial uses — teams should verify their use case against the full license terms before building on it.
Best Open Source LLM Observability Tools
These five tools were selected based on active open-source development, real-world adoption, self-hosting support, integration breadth, and coverage of the four core observability needs outlined above. They vary significantly in scope — from full engineering platforms to bare instrumentation libraries — so the right choice depends on what your stack already handles.
Langfuse
Langfuse is the most feature-complete open-source option on this list — an MIT-licensed LLM engineering platform with 29.4k GitHub stars and a January 2026 acquisition by ClickHouse. It covers the full development lifecycle: tracing, prompt management, evaluation workflows, datasets, and session-level debugging.
Key capabilities:
- OpenTelemetry-native — traces flow into existing infrastructure without custom adapters
- Prompt management as a first-class feature — version, deploy, and compare prompts without redeployment cycles
- Dual evaluation modes — LLM-as-judge scoring for automated rubric-based evaluation, plus human annotation queues for domain expert review
- Broad framework support — LangChain, LlamaIndex, LiteLLM, Vercel AI SDK, Mastra, OpenAI SDK
| Attribute | Details |
|---|---|
| License / GitHub Stars | MIT; 29.4k stars |
| Self-Hosting | Docker Compose; reaches ready state in ~2-3 minutes; no usage limits on self-hosted version |
| Cloud Pricing | Free: 50k units/month, 30-day retention, 2 users. Core: $29/month for 100k units/month |
Arize Phoenix
Phoenix is a source-available AI observability platform from Arize AI, built specifically for LLM applications, RAG pipelines, and multi-step agent workflows. With 10.2k GitHub stars and an Elastic License 2.0, it runs locally, in a Jupyter notebook, or via Docker with zero external dependencies — making it a strong fit for ML engineers who need observability during experimentation, not just in production.
Standout features:
- OpenTelemetry + OpenInference standards — vendor-neutral instrumentation that routes traces to any compatible backend
- RAG-specific visibility — prebuilt metrics for retrieval relevance, hallucination risk (faithfulness, Q&A accuracy), and embedding-distance evaluation
- Notebook-first design — shortens feedback loops during model iteration; you can run Phoenix inside a Jupyter session without spinning up any external services
One important note: the Elastic License 2.0 restricts offering Phoenix as a managed service. Review whether your use case falls within those restrictions before committing.
| Attribute | Details |
|---|---|
| License / GitHub Stars | Elastic License 2.0; 10.2k stars |
| Self-Hosting | Runs locally, in Jupyter, or via Docker — zero external dependencies |
| Cloud Pricing | Phoenix Cloud: 2 free instances available. Managed Arize AX Pro: $50/month for 50k spans, 10GB ingestion, 30-day retention |
Helicone
Helicone is an Apache 2.0-licensed proxy-first observability platform with 5.8k GitHub stars. Instead of installing an SDK or adding instrumentation code, you swap your base URL and Helicone starts logging every request automatically — full request history, cost tracking, and caching from the first call.
What sets it apart:
- Fastest path to production visibility — under 5 minutes, no code instrumentation required
- Intelligent request caching — reduces repeated API costs on identical or similar requests
- Provider failover and per-user rate limiting — useful for multi-tenant applications managing spend across customer segments
One important caveat: Mintlify acquired Helicone in March 2026, and it is operating in maintenance mode — receiving security updates and bug fixes, but not active feature development. Factor this into your long-term tooling decisions if active development matters to your roadmap.
| Attribute | Details |
|---|---|
| License / GitHub Stars | Apache 2.0; 5.8k stars |
| Self-Hosting | Docker Compose and Kubernetes/Helm; only a base URL change required |
| Cloud Pricing | Free: 10k requests/month, 7-day retention, 1 seat. Pro: $79/month. Team: $799/month |
OpenLLMetry
OpenLLMetry is an Apache 2.0-licensed instrumentation library — not a full platform — with 7.2k GitHub stars. It instruments Python and TypeScript LLM applications with a single initialization call, then ships traces to any OpenTelemetry-compatible backend: Datadog, Honeycomb, Grafana, Dynatrace, New Relic, Splunk, and others.
What sets it apart:
- Backend-agnostic by design — slots into your existing observability stack without replacing it; switch backends without re-instrumenting
- Broad provider coverage — OpenAI, Anthropic, Cohere, Azure OpenAI, Amazon Bedrock, Google Vertex AI
- Framework support — LangChain, LlamaIndex, Haystack, CrewAI
- Single-line setup —
Traceloop.init(...)and you're instrumented
OpenLLMetry has no built-in dashboards, evaluation tools, or prompt management — it's purely an instrumentation layer. Teams that already run a strong observability backend and want LLM-specific telemetry added to it will get more value from OpenLLMetry than from a standalone platform.
| Attribute | Details |
|---|---|
| License / GitHub Stars | Apache 2.0; 7.2k stars |
| Self-Hosting | Instrumentation library only; pairs with any OTel-compatible backend |
| Pricing | Free; no platform costs — backend costs depend on your chosen destination |
Opik by Comet
Opik is an Apache 2.0-licensed observability and evaluation platform from Comet ML with 19.7k GitHub stars. It combines tracing (LLM calls, agent steps, RAG pipelines) with built-in prompt optimization and native production guardrails — treating evaluation and safety as core features rather than add-ons.
Where Opik goes further:
- Automated prompt optimization — 8+ algorithms including Few-Shot Bayesian, Evolutionary, MetaPrompt, MIPRO, and others, which is rare in open-source tooling
- Native guardrails — PII detection, competitor mention blocking, off-topic detection built into the platform
- Generous free tier — 25k spans/month, up to 10 team members, 60-day retention
- Comet ML integration — one of few tools that serves both LLM app developers and teams training or fine-tuning models on the same platform
Most observability tools tell you where quality breaks down. Opik goes a step further by running optimization algorithms against those gaps — which is rare at this price point in open-source tooling.
| Attribute | Details |
|---|---|
| License / GitHub Stars | Apache 2.0; 19.7k stars |
| Self-Hosting | Fully self-hostable; same codebase as hosted versions |
| Cloud Pricing | Free: 25k spans/month, up to 10 team members, 60-day retention. Pro: $19/month for 100k spans |
How We Chose These Tools
Tools were evaluated across five dimensions:
- Active open-source development — license type, GitHub activity, community adoption
- Self-hosting viability — can teams actually deploy this without significant ops overhead?
- Integration breadth — coverage of major LLM providers and frameworks
- Core capability coverage — tracing, evaluation, cost tracking, and prompt management
- Free/hosted tier maturity — are the free tiers actually useful, or are critical features paywalled?
A common mistake is selecting a tool based on setup speed or GitHub stars without checking whether it covers evaluation. Logging requests is the easy part. Scoring output quality is where most tools diverge.
Why Each Criterion Matters
| Criterion | Business Outcome |
|---|---|
| Tracing depth | Reduces MTTR on production failures |
| Evaluation maturity | Prevents silent quality regressions reaching users |
| Prompt management | Enables non-engineering teams to iterate without deployments |
| Self-hosting support | Ensures data residency and compliance |
| Vendor-neutral instrumentation | Protects against lock-in as your stack evolves |
When to Consider a Unified LLMOps Platform
Standalone observability tools handle monitoring well. But Gartner predicts over 40% of agentic AI projects will be canceled by end-2027 due to escalating costs and inadequate risk controls, neither of which observability alone addresses.
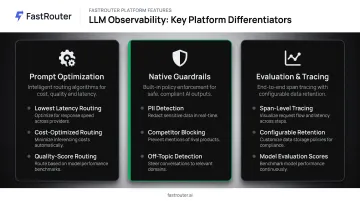
Teams that also need multi-provider routing, cost governance, guardrails, and experiment tracking in a single control plane often find that managing separate tools for each concern creates more overhead than it saves. Platforms like FastRouter combine real-time observability with intelligent routing, automatic failover, spend caps, and policy enforcement across 100+ models — worth evaluating when your requirements extend beyond monitoring alone.
Conclusion
The right tool depends on your primary bottleneck:
- Langfuse — deepest feature set, best for full lifecycle management from tracing to evaluation
- Arize Phoenix — best RAG pipeline visibility and notebook-first debugging workflows
- Helicone — fastest setup, useful for multi-tenant cost management (note: maintenance mode)
- OpenLLMetry — best for teams with existing observability stacks who want LLM-specific instrumentation
- Opik — best for teams that want evaluation, guardrails, and prompt optimization in one tool
Beyond current features, weigh these long-term factors before committing:
- License compatibility with your deployment model (self-hosted vs. cloud)
- Maintenance health — active community and recent releases matter at scale
- Scalability as trace volumes grow from thousands to millions of spans
- Agent workflow support if your architecture is moving in that direction
Teams that need more than observability — routing, cost governance, guardrails, and evaluations under one OpenAI-compatible API — can find all of that in FastRouter. It's designed as the production control plane that unifies these capabilities rather than requiring a separate point tool for each.
Frequently Asked Questions
What is LLM observability, and how is it different from traditional application monitoring?
Traditional APM tracks infrastructure metrics — latency, uptime, error rates. LLM observability adds a quality dimension: evaluating whether model outputs are faithful, relevant, and safe, not just whether the API call succeeded. A response can return HTTP 200 and still be a hallucination.
Which open-source LLM observability tool has the most flexible license for commercial use?
MIT (Langfuse) and Apache 2.0 (OpenLLMetry, Opik, Helicone) are the most commercially permissive. Elastic License 2.0 (Arize Phoenix) restricts managed-service use, so verify your deployment model against the license before committing.
Which open-source LLM observability tool is best for RAG pipelines?
Arize Phoenix is the strongest choice, with prebuilt metrics for retrieval relevance, faithfulness, hallucination risk, and embedding-distance evaluation. Opik is a strong alternative if you also need native guardrails and prompt optimization for production RAG use cases.
Do these open-source tools support self-hosting for data privacy compliance?
All five support self-hosting. Langfuse (Docker Compose, ~2-3 minutes), Opik (full feature parity with hosted), and Helicone (Docker Compose and Helm) offer the most straightforward deployment paths for teams with data residency or compliance requirements.
What's the difference between LLM tracing and LLM evaluation?
Tracing records what happened — prompts, responses, latencies, tool calls, token counts. Evaluation assesses whether what happened was good — scoring outputs for faithfulness, relevance, or safety. Most mature tools offer both, but evaluation depth varies significantly across the five covered here.
When should a team move beyond a standalone observability tool to a full LLMOps platform?
Standalone tools work at smaller scale. Once teams add multi-provider routing, cost governance, guardrails, and experiment tracking, managing separate tools for each becomes operationally expensive. A unified LLMOps platform — such as FastRouter — consolidates these concerns into a single control plane.