LLM observability platforms close that gap. They give teams end-to-end visibility into every model call, agent step, retrieval query, and tool invocation — with quality scores, cost data, and debugging tools attached. The goal isn't just logging; it's moving from reactive firefighting to proactive operations.
This guide covers what LLM observability actually means in production, the five platforms worth evaluating in 2026, and how to match each tool to your team's real bottleneck.
Key Takeaways
- LLM observability covers the full AI request lifecycle: traces, agent steps, tool calls, retrieval, cost, and output quality
- The best platforms score outputs, alert on regressions, and integrate evaluation directly into CI/CD pipelines
- Core selection criteria: tracing depth, built-in evaluation, cost governance, OpenTelemetry support, and pricing predictability
- Top picks for 2026: FastRouter, Langfuse, Arize Phoenix, LangSmith, and Braintrust — each optimized for different bottlenecks
- Match your tool to your primary need before comparing feature grids
What Is LLM Observability and Why Does It Matter in Production?
Traditional monitoring tells you whether the service is up. LLM observability covers harder ground: whether the output was correct, why the agent made a specific decision, and what that session cost in tokens.
Arize defines it as "complete, real-time visibility into every layer of an LLM-based system" — from a single model call through multi-step agentic workflows. That scope matters because LLM failure modes are fundamentally different from web service failures.
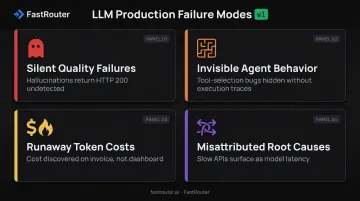
The Four Production Failure Modes
Standard monitoring misses all of these:
- Silent quality failures: hallucinations that return HTTP 200 and never trigger an alert
- Invisible agent behavior — tool-selection bugs that look like model errors until you see the full execution trace
- Runaway token costs: discovered on the monthly invoice, not a real-time dashboard
- Misattributed root causes — a slow database query or rate-limited external API that surfaces as apparent model latency
The Air Canada chatbot case illustrates what's at stake: a 2024 British Columbia Civil Resolution Tribunal ruling held the airline liable for incorrect information its AI chatbot provided to a customer. A status-code check would have missed it entirely.
Cases like this drove demand for purpose-built observability tooling — and the market responded by splitting into specialized categories.
How the Tooling Landscape Has Split
The observability market has fragmented into distinct categories:
| Category | Primary Strength | Example Tools |
|---|---|---|
| All-in-one LLMOps platforms | Routing + observability + cost governance | FastRouter |
| Open-source tracing platforms | Self-hosted; full data control | Langfuse, Phoenix |
| Evaluation-first platforms | Regression testing, CI/CD gating | Braintrust |
| Ecosystem-native tools | Deep framework integration | LangSmith |
Choosing the right category — not just the right tool within a category — determines whether the platform actually solves your bottleneck. The sections below walk through each one so you can match the option to your production requirements.
Best LLM Observability Platforms in 2026
Platforms were evaluated across six criteria:
- Tracing granularity and span visibility
- Built-in evaluation capabilities
- Multi-provider support
- Open-standards compatibility (OTel, OpenInference)
- Pricing transparency
- Production scalability
FastRouter
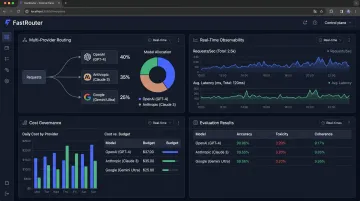
FastRouter is an LLMOps control plane that combines multi-provider model routing, real-time observability, experiment tracking, guardrails, cost governance, and evaluations in a single OpenAI-compatible interface across 100+ models.
The distinction matters. Most teams end up with a gateway tool (for routing and failover), a separate observability tool (for tracing and quality), and often a third tool for evaluation. FastRouter is designed to eliminate that stack by providing a unified view of cost, latency, quality, and model behavior across all providers from one control plane.
For teams scaling beyond a single model or provider — running OpenAI alongside Anthropic Claude, Google Gemini, and xAI Grok — the unified routing-plus-observability architecture means every request is traced, costed, and quality-checked without instrumenting multiple systems.
Instrumentation requires only two code changes: swap the base_url to https://go.fastrouter.ai/api/v1 and replace the API key.
| Key Features | OpenAI-compatible multi-provider routing across 100+ models, real-time observability, guardrails, cost governance, experiment tracking, and evaluations in a single control plane |
| Pricing | Pay-as-you-go; free credits (no credit card required) to start; full pricing details at fastrouter.ai |
| Best For | Engineering teams running LLMs in production who want unified routing, observability, guardrails, and cost governance without managing multiple tools |
Langfuse
Langfuse is the open-source leader in LLM observability — 29,400+ GitHub stars, MIT-licensed, and acquired by ClickHouse in January 2026 with an explicit commitment to maintain the MIT license and unlimited self-hosting.
Built on OpenTelemetry natively, Langfuse traces are portable to any OTel-compatible backend. Prompt management is a first-class feature: version control, playground testing, and direct linkage between prompt changes and trace behavior. Integrations cover LangChain, LlamaIndex, LiteLLM, Vercel AI SDK, and 50+ other frameworks.
Worth clarifying: Langfuse does include native evaluation support — LLM-as-a-Judge and manual scoring via UI — so evaluation doesn't require fully external tooling, though teams wanting deep automated evaluation workflows may need additional configuration.
| Key Features | OTel-native tracing, session grouping, prompt versioning with playground, LLM-as-judge and human annotation, cost attribution dashboards; Python and TypeScript SDKs |
| Pricing | Self-hosted: free (unlimited). Cloud: Hobby free; Core $29/month; Pro $199/month; Enterprise $2,499/month |
| Best For | Teams requiring data sovereignty, self-hosted infrastructure, or an open-source tracing backbone they can extend |
Arize Phoenix
Phoenix is an OpenTelemetry-native, open-source observability and evaluation platform from Arize AI with 10,200+ GitHub stars. It uses the OpenInference tracing convention, so traces flow to any compatible backend — no instrumentation lock-in.
Setup is deliberately low-friction: runs locally in a notebook or Docker container for development, scales to the managed Arize AX enterprise platform for production. Its strongest differentiation is RAG evaluation depth — retrieval relevance, groundedness, and document chunk visualization are built in, not bolted on. First-class framework support covers OpenAI Agents SDK, LangChain, LlamaIndex, LangGraph, and CrewAI.
One structural tradeoff to flag: moving from open-source Phoenix to commercial Arize AX is a separate purchase decision, not an in-product upgrade path.
| Key Features | OTel + OpenInference tracing, built-in eval metrics (faithfulness, relevance, safety), RAG-specific evaluation, agent workflow visualization, local/notebook-first setup |
| Pricing | Phoenix open-source: free (self-hosted, Elastic License 2.0). Arize AX: Free (25K spans/month); Pro $50/month; Enterprise custom |
| Best For | Evaluation-heavy teams, RAG application builders, and ML teams who want strong evaluation depth without vendor lock-in |
LangSmith
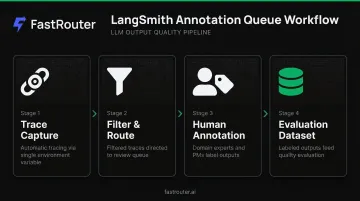
LangSmith is the observability and evaluation platform from the LangChain team. One environment variable (LANGSMITH_TRACING=true) enables automatic tracing across chains, agents, and tool calls — no code changes required for LangChain and LangGraph applications. Recent additions include LangSmith Engine, which diagnoses root causes and surfaces recurring issues automatically.
Its annotation queues are a genuine differentiator: filtered traces route to structured human review workflows, enabling domain experts and PMs to label outputs that feed directly into evaluation datasets. LangGraph Studio provides a visual development environment for agent workflows.
Key tradeoffs: self-hosting is enterprise-only, and per-seat plus per-trace pricing can scale unpredictably for large teams outside the LangChain ecosystem.
| Key Features | Native LangChain/LangGraph tracing, annotation queues for human review, LLM-as-judge evaluators, multi-turn evaluation, prompt management, agent metrics |
| Pricing | Developer: free (5K traces/month). Plus: $39/seat/month (10K traces included). Enterprise: custom |
| Best For | Teams committed to the LangChain and LangGraph ecosystem who want automatic deep-tracing with structured annotation workflows |
Braintrust
Braintrust flips the conventional model: tracing is built around its evaluation and CI/CD workflow, not the other way around. Teams define datasets, run prompt variations, compare results side by side, and gate deployments when quality regresses.
Its Loop feature generates custom scorers from natural-language descriptions. Brainstore, its purpose-built data layer, handles fast queries across millions of traces.
The CI/CD integration is the strongest on this list — evaluations run on every code change and can block deploys when quality drops below threshold. Its AI gateway routes calls through Braintrust, enabling automatic log capture and fallbacks. Braintrust supports self-hosting via data-plane deployment into your own infrastructure (Terraform-based, not Docker).
| Key Features | Eval-gated CI/CD pipeline, multi-step trace visualization, custom and automated scorers (Loop), AI gateway, dataset versioning, prompt playground |
| Pricing | Starter: free. Pro: $249/month. Enterprise: custom |
| Best For | Teams whose primary bottleneck is regression testing and eval-gated deployment — quality as a first-class CI/CD signal |
How We Chose the Best LLM Observability Platforms
Platforms were assessed against official documentation, GitHub activity and community feedback, pricing transparency, and production readiness.
The most common selection mistake is chasing the richest feature grid instead of matching the tool to the actual bottleneck. A team struggling with routing reliability gets nothing from a deep evaluation suite. A team debugging quality regressions in a multi-agent system will outgrow a lightweight gateway in weeks.
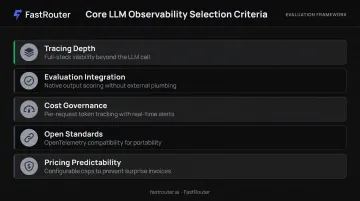
Core Selection Criteria
- Tracing depth : Can it follow a request through the full stack, not just the LLM call? Agent steps, tool invocations, and retrieval queries must all be visible.
- Evaluation integration : Does it score outputs natively, or does every quality signal require external tooling and custom plumbing?
- Cost governance : Per-request token tracking with alerting, not just aggregate monthly dashboards.
- Open-standards compatibility : OpenTelemetry graduated as the de facto observability standard in May 2026. OTel support ensures portability and prevents instrumentation lock-in.
- Pricing predictability : Tiered or usage-based models with configurable caps. Surprise invoices at scale are a real risk with per-trace pricing.
Conclusion
The right LLM observability platform is the one that matches your team's immediate operational bottleneck — not the one with the most checkboxes:
- Tracing sovereignty → Start with Langfuse or Phoenix
- Living in LangChain → LangSmith handles tracing with near-zero setup
- Eval-gated CI/CD → Braintrust is purpose-built for this
- Unified routing + observability without stitching tools → Evaluate FastRouter
Whichever option fits your current need, assess total cost of ownership before committing. Free-tier pricing rarely reflects what you'll pay at scale — and the real cost often comes from adding a second or third tool as requirements grow (a separate gateway, a separate evaluator, separate monitoring). A unified LLMOps platform cuts that sprawl by design.
Teams building or scaling production LLM applications can explore FastRouter as an operational foundation that unifies model routing, observability, guardrails, and cost governance in a single OpenAI-compatible control plane — with free credits available, no credit card required.
Frequently Asked Questions
What is an LLM observability platform and why do production teams need one?
An LLM observability platform captures the full execution of AI requests — including agent steps, tool calls, and retrieval — with cost, latency, and quality data attached. It lets production teams debug failures, catch quality regressions, and control spend in ways traditional monitoring cannot, because it sees inside the model interaction itself, not just the HTTP response.
How is LLM observability different from traditional application monitoring?
Traditional monitoring tells you whether a service is up and how fast it responds. LLM observability tells you whether an output was correct, why an agent took a specific action, and what a request cost in tokens. The failure modes are different enough that standard APM tools simply don't apply.
What key features should I look for in an LLM observability platform?
Prioritize platforms that offer:
- Step-level tracing across agent steps, tool calls, and retrieval (not just input/output)
- Built-in evaluation metrics — faithfulness, relevance, hallucination detection
- Cost-per-request tracking with threshold alerts
- OpenTelemetry compatibility for vendor portability
- Prompt versioning to correlate prompt changes with quality shifts
Which LLM observability platforms support self-hosting or open-source deployment?
Langfuse (MIT license) and Arize Phoenix (Elastic License 2.0) are the primary self-hostable options with no feature gates. Helicone (Apache 2.0) and Portkey's gateway (MIT) also offer self-hosting. Braintrust supports self-hosting via Terraform-based data-plane deployment. LangSmith self-hosting is enterprise-only.
Do I need separate tools for LLM routing and observability, or can one platform handle both?
Most dedicated observability tools (Langfuse, Phoenix, LangSmith) don't include multi-provider routing, and most gateway tools offer limited evaluation depth. Unified LLMOps platforms like FastRouter address this directly by combining routing, observability, guardrails, and cost governance in a single control plane.
How much do LLM observability platforms typically cost?
Langfuse is free to self-host, with cloud plans from $29/month. LangSmith is $39/seat/month. Arize AX starts at $50/month. Braintrust Pro is $249/month. Always evaluate total cost at your expected trace volume — entry-tier prices rarely reflect what high-volume production use costs.