According to Arize's State of AI Engineering survey, 41% of AI teams rely on LLM observability for evaluating and tracing generative AI applications, with privacy, accuracy, and hallucinations cited as top barriers. The LLM observability market is projected to reach $9.26B by 2030 at a 36.2% CAGR — a signal of how quickly teams are recognizing the gap.
This guide covers what LLM observability tools actually do, what to look for when evaluating them, and a breakdown of the best options available in 2025.
Key Takeaways
- LLM observability tracks output quality, not just latency and error rates — filling the visibility gap traditional APM tools miss
- Span-level traces are essential for debugging multi-step agents and RAG pipelines
- Top tools in 2025: LangSmith, Langfuse, Arize Phoenix, Helicone, and FastRouter
- Langfuse and Arize Phoenix are fully open-source with self-hosting support; Helicone offers an open-source tier but is primarily cloud-hosted
- Teams at scale benefit from a unified LLMOps control plane rather than cobbling together separate point solutions
What Is LLM Observability?
LLM observability means tracking how language model applications behave in production — capturing inputs, outputs, intermediate steps, token usage, latency, cost, and output quality across every request.
Traditional APM tools monitor infrastructure. They tell you if a service is slow or down. What they cannot tell you is whether an AI response was factually correct, contextually relevant, or safe. A well-instrumented LLM pipeline can fail silently in ways that never register as errors.
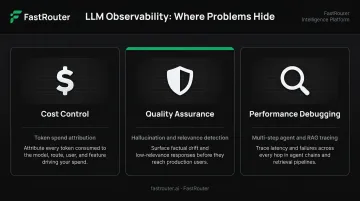
LLM observability solves three specific problems:
- Cost control — identifying which prompts, users, or features are driving token spend before costs spiral
- Quality assurance — detecting hallucinations, relevance degradation, and off-topic outputs proactively
- Performance debugging — tracing failures across multi-step agents, RAG pipelines, and tool-calling workflows where a standard stack trace doesn't exist
Each of these problems maps to a different failure mode — and the tool landscape reflects that. Solutions now range from open-source tracing libraries and evaluation-first platforms to AI gateways with built-in logging and full LLMOps control planes. Knowing which failure mode matters most to your team is the clearest starting point for choosing between them.
What to Look for in an LLM Observability Tool
Tracing Depth and Agent Support
Request-level logging is the floor, not the ceiling. For multi-step agents, teams need span-level traces that capture every tool call, retrieval step, reranking operation, and intermediate reasoning step within a chain or agent workflow.
LangChain's agent observability guide makes this concrete: a 200-step agent run has no stack trace. Without span-level visibility, you cannot identify where reasoning went wrong. Without it, diagnosing a hallucination or tool-call failure in a complex agent means guessing — not debugging.
Evaluation and Quality-Aware Alerting
Tools like Datadog and New Relic alert on latency and error rates — but they cannot flag when outputs are factually wrong, hallucinated, or contextually irrelevant. For LLM applications, that gap matters.
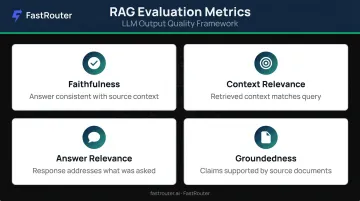
Look for tools with built-in evaluation metrics:
- Faithfulness — whether generated answers are consistent with source context
- Context relevance — whether retrieved context addresses the query
- Answer relevance — whether the response actually answers what was asked
- Groundedness — whether claims are supported by source documents
Quality-aware alerting fires on score drops, not just infrastructure events. That distinction means catching a regression before users notice it — not after a support ticket lands.
Cost Governance and Multi-Provider Support
LLM APIs charge per token, and cost structures vary significantly across providers. Rates differ by:
- Token type — input, output, and cached tokens priced separately
- Processing mode — real-time vs. batch inference
- Model tier — flagship vs. cost-optimized variants
- Provider — OpenAI, Anthropic, and Google each use different rate structures
Without granular cost attribution by user, feature, model, or session, spend can spiral quickly across a multi-provider stack.
Teams running multi-provider setups need tools that attribute costs uniformly. The strongest tools go further — combining observability with caching and routing logic to actively reduce API spend, not just measure it.
Best LLM Observability Tools
The tools below were evaluated across tracing depth, evaluation capabilities, cost tracking, integration breadth, and fit for production AI workloads. Each entry covers what the tool does well and where it fits best.
LangSmith
LangSmith is the observability and evaluation platform built by the LangChain team. It captures the full execution tree of agents (tool calls, retrieval steps, model parameters) and supports both offline and online evaluations, including LLM-as-judge scoring and human annotation queues.
Key differentiators:
- Framework-agnostic tracing via Python, TypeScript, Go, and Java SDKs — works with OpenAI SDK, Anthropic SDK, LangGraph, LlamaIndex, CrewAI, and Vercel AI SDK
- Structured annotation queues for domain expert review of production traces
- AI-assisted trace analysis to surface root causes
- Step-level cost and latency attribution (P50/P99) for multi-step chains
- CI/CD integration with pytest, Vitest, and GitHub workflows
| Attribute | Details |
|---|---|
| Key Features | Full-stack agent tracing, LLM-as-judge evaluators, annotation queues, online and offline eval modes, CI/CD integration |
| Pricing | Free tier (5,000 traces/month, 14-day retention); Plus at $39/seat/month; Enterprise custom |
| Best For | Teams building complex agents or multi-step workflows who need deep trace visibility and structured evaluation |
Langfuse
Langfuse is the leading open-source LLM engineering platform, MIT-licensed and deployable via Docker for teams requiring full data ownership. With 29,400+ GitHub stars, it has strong community traction. It combines tracing, prompt management, and evaluation in one tool.
Key differentiators:
- OpenTelemetry-native trace capture integrates into existing infrastructure without rearchitecting
- Prompt versioning is a first-class feature — teams track how prompt changes affect evaluation scores over time, not just output text
- Broad framework support: LangChain, LlamaIndex, LiteLLM, OpenAI SDK, and Vercel AI SDK
- Session grouping for multi-turn conversation analysis
| Attribute | Details |
|---|---|
| Key Features | OTel-native tracing, prompt versioning, LLM-as-judge scoring, session grouping, self-hosting via Docker, multi-framework support |
| Pricing | Free self-hosted (no usage limits); cloud from $29/month; Enterprise from $2,499/month |
| Best For | Engineering teams needing open-source, self-hostable observability with full data ownership and strong prompt management |
Arize AI (Phoenix)
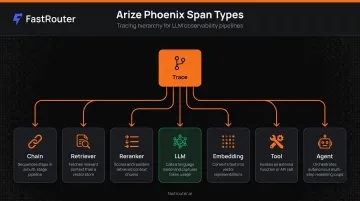
Arize AI extends its ML monitoring heritage into LLM applications through Phoenix — an open-source, local-first observability library built on OpenTelemetry and the OpenInference tracing standard. It provides full data portability without vendor lock-in.
Key differentiators:
- Seven distinct span types (Chain, Retriever, Reranker, LLM, Embedding, Tool, Agent) make trace data immediately scannable
- Strong RAG-specific evaluation metrics for retrieval relevance and groundedness
- Phoenix runs fully self-hosted: data stays within your infrastructure, nothing is sent to Arize, and deployments can be fully air-gapped
- The commercial AX platform adds hosted evaluations and experiment gating
- Framework support: LlamaIndex, LangChain, DSPy, Haystack
| Attribute | Details |
|---|---|
| Key Features | OTel + OpenInference instrumentation, 7 span types, RAG evaluation metrics, local/notebook deployment, multi-framework support |
| Pricing | Phoenix OSS: free (self-hosted); AX Free: 25,000 spans/month; AX Pro: from $50/month; Enterprise: custom |
| Best For | Teams building RAG-heavy applications, ML engineers wanting notebook-friendly observability, organizations requiring full OTel portability |
Helicone
Helicone is a proxy-based LLM observability tool and AI gateway. Rather than requiring SDK instrumentation, it works by changing the API base URL, giving teams full request logging, cost tracking, and caching with minimal code changes and negligible latency overhead.
Key differentiators:
- Fastest time-to-value of any tool here — deployable in minutes without restructuring application code
- Automatic cost calculation across 300+ models using an open-source pricing database
- Intelligent caching to reduce API spend on repeated queries
- Per-user rate limiting via headers for multi-tenant applications
- Apache v2.0 licensed with Docker and Helm self-hosting support
- Benchmark data shows mean latency overhead of under 1ms in most practical applications
| Attribute | Details |
|---|---|
| Key Features | Proxy-based setup (one-line integration), request-level logging, cost tracking for 300+ models, intelligent caching, automatic failover, multi-provider support |
| Pricing | Free tier (10,000 requests/month); Pro at $79/month; Team at $799/month; Enterprise custom |
| Best For | Teams wanting observability and cost tracking running in minutes without code restructuring, especially multi-provider setups |
FastRouter
FastRouter is an LLMOps platform built as a single OpenAI-compatible control plane that unifies multi-provider model routing, real-time observability, experiment tracking, guardrails, cost governance, and evaluations across 100+ models. Where the tools above address tracing or evaluation in isolation, FastRouter covers the full operational stack teams need to run LLMs reliably in production.
Key differentiators:
- Real-time observability is built into the routing layer — every request is automatically traced and logged without additional SDK setup
- Cost governance goes beyond tracking to provide active control over spend across providers
- Guardrails and evaluations run inline, enforcing quality and safety policies at the model call level
- OpenAI-compatible API means teams can point existing SDK integrations at FastRouter by changing the base URL — no code rewrites
- Covers 100+ models across OpenAI, Anthropic, Google Gemini, xAI Grok, Azure, Groq, and others
| Attribute | Details |
|---|---|
| Key Features | OpenAI-compatible control plane, multi-provider routing, real-time observability, experiment tracking, guardrails, cost governance, evaluations across 100+ models |
| Pricing | Visit FastRouter's official website for current pricing — free credits available with no setup fees |
| Best For | Teams wanting a unified LLMOps platform that combines observability, routing, guardrails, and cost governance in one place |
How We Chose the Best LLM Observability Tools
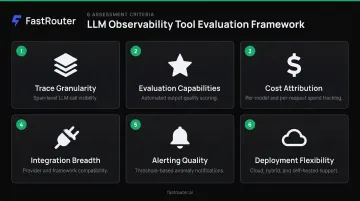
Tools were evaluated across six dimensions:
- Trace granularity — request-level vs. span-level vs. agent-level visibility
- Evaluation capabilities — built-in quality metrics vs. custom-only implementations
- Cost attribution — granularity by model, user, feature, and session
- Integration breadth — frameworks and model providers supported
- Alerting quality — infrastructure-only vs. quality-aware scoring alerts
- Deployment flexibility — cloud, self-hosted, and open-source options
Many teams choose a tool based on ease of setup, then discover mid-production that it lacks the evaluation depth or cost governance they actually need. LangChain's State of AI Agents report found that while 94% of teams running agents in production had observability in place, only 52% used offline evaluation and 37% used online evaluation — a clear gap between logging and actual quality improvement.
That gap makes tool selection a strategic call, not just a setup decision. Three questions should drive it:
- Does the team need output quality evaluation, or only operational metrics?
- Is open-source self-hosting required for data ownership or compliance?
- Does the team need a standalone observability tool, or a broader LLMOps platform that also handles routing, guardrails, and cost governance?
Conclusion
The right tool depends on where your team is in its AI journey. Teams in early stages typically benefit from fast setup and immediate cost visibility — Helicone and Langfuse both fit that profile well. Teams running complex agents in production need deeper evaluation, quality-aware alerting, and multi-step trace visualization — LangSmith and Arize Phoenix are built for that.
For teams managing multi-provider deployments at scale, a full LLMOps control plane like FastRouter offers the most leverage — combining observability, routing, and cost governance in one layer rather than requiring separate tools for each concern. Explore FastRouter to see how it fits your production stack.
One practical consideration: the cost of migrating from a lightweight logger to a full observability platform mid-production is significant. Teams invest in prompts, guardrails, and agent workflows — changing one component affects downstream dependencies. Evaluate tools against the workflows you'll need in six months, not just what works today.
Frequently Asked Questions
What is LLM observability and why does it matter in production?
LLM observability gives teams visibility into what language models are doing in production by capturing inputs, outputs, latency, token usage, and quality signals. Unlike traditional monitoring, it detects output quality issues like hallucinations or relevance degradation before they reach users.
What's the difference between LLM observability and traditional APM?
Traditional APM (Datadog, New Relic) monitors infrastructure metrics like latency, error rates, and uptime. LLM observability evaluates the content of model responses across quality dimensions like faithfulness, relevance, and safety. These are failures that return HTTP 200 but still produce wrong or harmful outputs.
What features should I look for when choosing an LLM observability tool?
Prioritize span-level tracing for multi-step agents, built-in quality evaluation metrics, cost attribution by model and user, quality-aware alerting, multi-provider support, and deployment flexibility. Ease of setup matters, but evaluation depth and cost governance often become the deciding factors in production.
Are there open-source LLM observability tools available?
Yes — Langfuse (MIT license), Arize Phoenix (Elastic License 2.0), and Helicone (Apache 2.0) all support self-hosting for teams with data sovereignty or compliance requirements. Langfuse and Phoenix in particular have strong community adoption and active development.
How do LLM observability tools help with cost management?
Observability tools track token usage per request and attribute costs by user, feature, model, or session to surface which prompts or workflows are driving spend. More advanced tools combine observability with caching, routing, and cost governance to actively reduce API spend rather than just measure it.
What is the difference between an AI gateway and an LLM observability platform?
AI gateways (like Helicone) sit between an application and LLM providers to handle routing, caching, and failover, with observability as a built-in feature. Dedicated observability platforms provide deeper tracing, evaluation metrics, and quality alerting. Some platforms, including FastRouter, combine both into a single control plane that covers routing, cost governance, and evaluation without requiring separate tools.