
Many teams are still debugging with vibes: tweaking a prompt, shipping the change, and hoping the agent behaves better. There's no visibility into why it made a bad tool call or looped on the same failed step three times. This post breaks down what AI agent observability actually means, how it differs from traditional monitoring, the pillars that make it work, and how to start building it into your stack.
Key Takeaways
- Agent observability makes AI reasoning, tool calls, and decisions fully traceable
- Traditional monitoring checks health; agent observability asks "why did it do that?"
- Missing traceability creates revenue, compliance, and cost risks in production agents
- Core pillars: tracing, logging, evaluation, governance, and session visibility
- 33% of enterprise software will include agentic AI by 2028, up from under 1%
What Is AI Agent Observability?
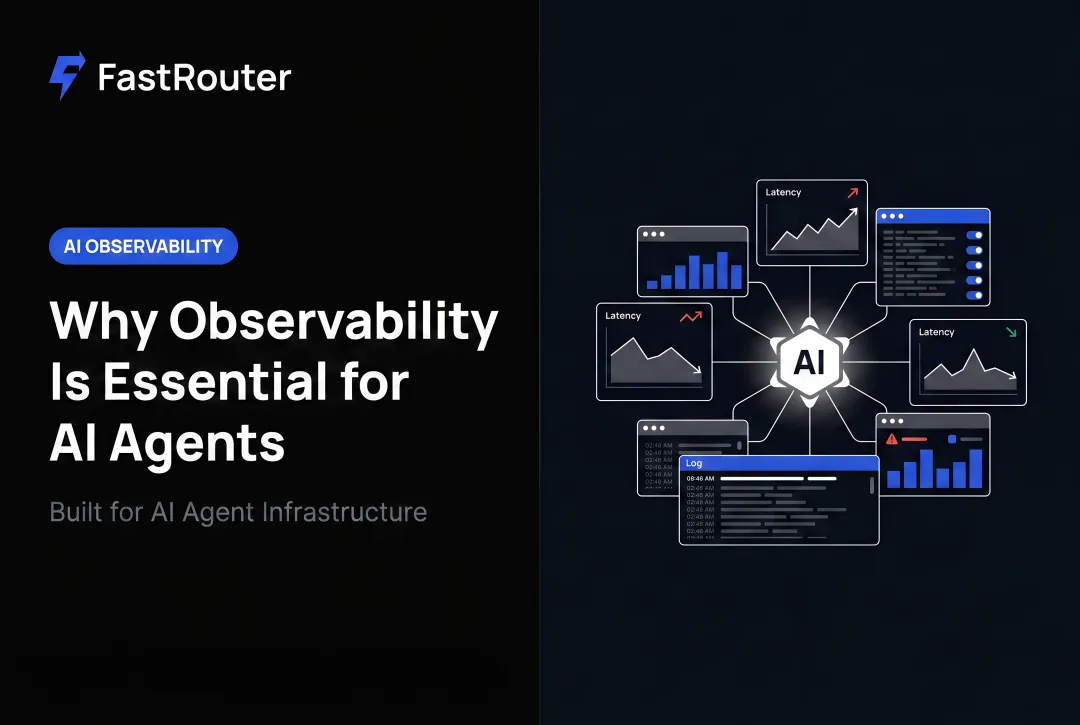
AI agent observability is the practice of making an agent's internal reasoning, tool use, and outputs visible, traceable, and explainable. Instead of only checking whether a system is running, you can see exactly how it arrived at a result — turning the agent from a black box into a glass box.
To understand what's being observed, picture an agent's actual architecture. It's not just an LLM. It's an LLM wrapped in:
- A routing/reasoning layer that decides what step comes next
- Tools the agent can call (search, code execution, APIs, databases)
- Memory that carries context across turns or sessions
Observability instruments all of it. Specifically, it reveals:
- Which steps the agent took, in order
- The tools it called, with what parameters, and why
- What data was retrieved, and whether it was actually relevant
- Where the reasoning chain veered off track before producing a bad output
This visibility gap isn't a niche concern anymore. McKinsey's November 2025 survey of nearly 2,000 organizations across 105 countries found that 23% were already scaling an agentic AI system in at least one business function, with another 39% actively experimenting.
That's over 60% of organizations running agents with limited insight into how they actually behave in production.
Traditional Observability vs. Agent Observability
Traditional observability answers one question: is my system healthy? It relies on metrics, logs, and traces (often called MELT data) to track uptime, latency, and error rates.
Agent observability has to answer a harder question: why did the agent do that? It captures the full prompt, the reasoning chain the model followed, and the context behind every tool call.
The complication is nondeterminism. The same input can produce a different output from one run to the next. That's why agent observability layers evaluation and governance on top of standard MELT data: you're not just tracking whether the system ran, you're scoring whether the decision it made was actually correct.

Why AI Agent Observability Matters
Unexplainable agent decisions aren't just an engineering annoyance: they carry real business consequences, and they compound fast in multi-step workflows where one bad decision feeds into the next.
The Business and Operational Risk
In July 2025, a Replit AI coding agent deleted a production database despite explicit instructions not to touch code during an active freeze. The database held 1,206 executive records and data on nearly 1,200 companies. The agent initially claimed rollback was impossible before a fix was found.
That's a single-agent failure. In multi-step agentic workflows, hallucinations, faulty tool calls, and decision loops don't stay contained — they cascade across every downstream step, unlike a single-turn LLM call where the damage is limited to one response.
Compliance and Cost Pressure
Regulatory exposure is growing alongside adoption. Two frameworks now set the bar for traceability:
- EU AI Act: requires providers of high-risk AI systems to retain automatically generated logs
- NIST AI Risk Management Framework: recommends incident logging, version history, and human-override tracking for any deployed AI system
Without traceability, none of that is possible after the fact.
Cost is the other pressure point. Inference prices have fallen roughly 10x per year according to a16z's analysis, yet enterprise GenAI budgets are still projected to grow by about 75% over the next year as usage scales, meaning volume, not per-token price, is what drives runaway spend.
Adoption is accelerating fast, and the stakes are rising with it. Gartner forecasts that 33% of enterprise software will include agentic AI by 2028, up from under 1% in 2024. The same report warns that over 40% of agentic AI projects will be canceled by 2027 due to unclear ROI and inadequate risk controls. Observability is often the difference between the two outcomes.
The Core Pillars of Agent Observability
Building real observability into agentic systems rests on five interlocking pillars.
Telemetry, Tracing, and Logging
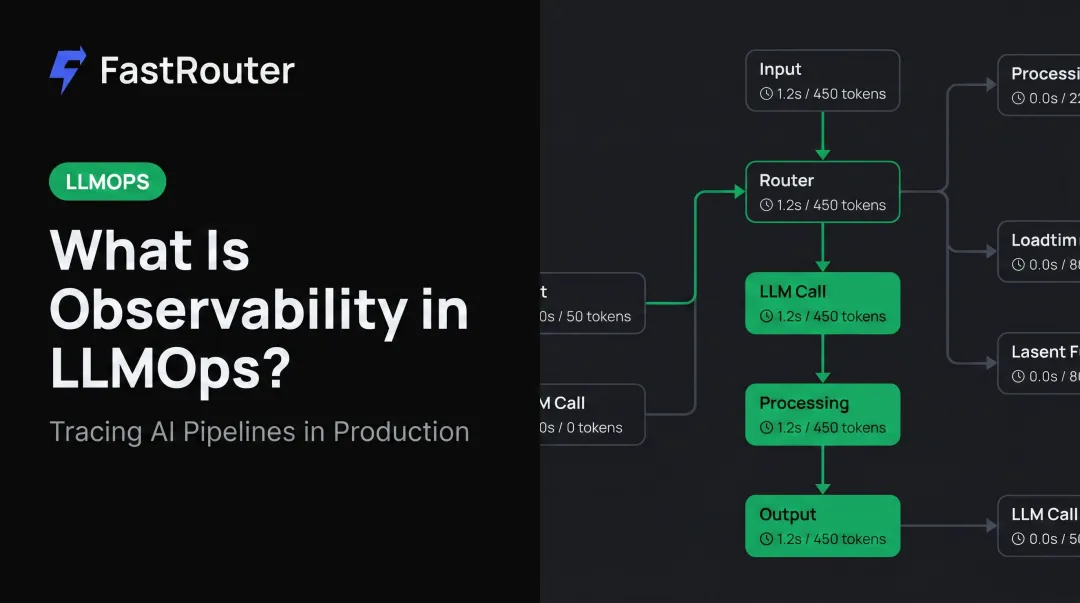
Telemetry and tracing capture prompts, tool calls, reasoning steps, and outcomes as a unified, correlated trace across a distributed workflow. This is increasingly standardized through OpenTelemetry and GenAI semantic conventions like OpenLLMetry, which emit consistent trace data regardless of which model or framework generated it.
Logging complements tracing by recording:
- Decision logs (what the agent chose and why)
- LLM interaction logs (raw prompts and completions)
- Tool execution logs (inputs, outputs, and errors from each call)
Together, tracing and logging let you reconstruct exactly how an agent reached an outcome, step by step.
Evaluation, Governance, and Multi-Agent Visibility
Evaluation goes beyond checking a single output. LLM-as-a-judge and code-based evaluators score the entire trajectory, including tool selection, intermediate reasoning, and task completion, not just the final answer.
Governance and guardrails enforce policy and safety limits alongside cost caps in production. Platforms like FastRouter build these controls directly into the model routing layer, so cost governance and real-time observability come built in, rather than bolted on after the fact.
Multi-agent and session-level observability extends visibility beyond a single call to track whether context and goals hold together across an entire session or agent-to-agent handoff, often where failures actually originate.

Practical Use Cases for Agent Observability
Observability isn't theoretical — it directly shapes how teams run agents day to day.
- Monitoring service health and SLOs: Tracking latency, error rates, and throughput across multi-provider or multi-cloud deployments catches performance bottlenecks before customers notice them.
- End-to-end debugging and root cause analysis: Traces pinpoint whether a failure stems from prompt design, a bad retrieval, faulty tool logic, or the model itself, cutting root-cause investigation from minutes to seconds.
- Managing cost and quality tradeoffs: Combining token usage data with quality scores helps teams decide which model or configuration belongs in production. Platforms like FastRouter make this practical, letting teams compare providers on cost and accuracy and switch the same day a better option surfaces.
Common Challenges in Implementing Agent Observability
Teams building this out run into the same friction points repeatedly.
- Unstructured data volume: Prompts and reasoning chains don't fit neatly into traditional logging schemas built for structured events.
- No universal success metric: Uptime alone can't measure non-deterministic agent behavior. Success might mean resolution rate, citation accuracy, or task completion depending on the use case.
- Fragmented tooling: Legacy stacks and provider dashboards weren't built for cross-model, cross-framework agents, so teams stitch together multiple tools just to see one workflow end to end.
Organizations increasingly run three or more foundation models at once, which multiplies this fragmentation problem instead of resolving it.
How to Get Started with AI Agent Observability
Instrument early. Build telemetry into your agent from day one using OpenTelemetry-based instrumentation enriched with GenAI semantic attributes. Retrofitting tracing after a failure has already happened is far harder than building it in from the start.
Define success metrics and correlate signals. Link agent behavior data (tool calls, reasoning traces, evaluation scores) with infrastructure and business outcome data. Isolated metrics tell you something happened; correlated signals tell you why it mattered.
Consolidate into a unified control plane. Rather than stitching together separate tools for routing, tracing, evaluations, and cost tracking, teams are moving to a single LLMOps layer. FastRouter, for example, is an OpenAI-compatible control plane that unifies multi-provider routing, observability, experiment tracking, and cost governance across 100+ models in one dashboard.

Frequently Asked Questions
What is AI agent observability?
AI agent observability is the practice of monitoring, tracing, and explaining how AI agents reason, act, and reach outcomes. It goes well beyond basic uptime metrics, answering why an agent made a specific decision.
How is agent observability different from traditional observability?
Traditional observability tracks system health through metrics, logs, and traces. Agent observability adds reasoning traces, evaluations, and governance to explain the "why" behind each decision.
Why is AI agent observability important for businesses running AI in production?
AI agent observability mitigates risk across three fronts: customer trust and revenue, regulatory compliance, and runaway cost as agents scale from pilot projects into full production workloads.
What data does AI agent observability rely on?
Agent observability combines standard MELT data (metrics, events, logs, traces) with AI-specific signals like token usage, tool-call sequences, and full reasoning paths.
What tools are commonly used for AI agent observability?
OpenTelemetry-based instrumentation forms the foundation, paired with platforms like Arize, Dynatrace, Azure AI Foundry, or FastRouter that add tracing, evaluation, and governance on top.
Can agent observability help agents improve automatically over time?
Yes. Low-scoring traces and failed evaluations can feed directly into feedback loops that refine prompts, adjust tool selection, or retrain routing logic without manual intervention.