.png&w=3840&q=100)
The Silent Failure Problem: Why Enterprise AI Systems Need Intelligent Observabillity
Monitor latency, token usage, errors, and spend in AI systems. Learn why enterprise AI needs intelligent observability to detect silent failures.

.png&w=3840&q=100)
When an AI system fails, it rarely fails loudly.
Traditional APIs operate in binary states—they work or they throw an error. Large Language Model systems are fundamentally different. They degrade gradually. Latency creeps from 800ms to 3.5 seconds. Token consumption doubles without warning. Error rates climb in subtle patterns across thousands of requests.
By the time engineering teams notice, users are already experiencing degraded service, SLAs are breached, or monthly AI budgets have quietly doubled.
This "silent failure" pattern represents one of the most significant operational challenges facing enterprises deploying production AI systems today. Unlike traditional infrastructure monitoring—which has matured over decades—AI observability requires a fundamentally different approach.
Why AI Workloads Break Traditional Monitoring
AI infrastructure behaves more like a probabilistic, resource-intensive system than a deterministic API. This creates observability gaps that standard Application Performance Monitoring (APM) tools weren't designed to address.
The core challenges:
Latency is non-deterministic. Response times depend on token generation speed, provider congestion, model complexity, and prompt length—not just infrastructure health. A "working" system can suddenly take 4× longer to respond without throwing a single error.
Token economics are invisible. Traditional monitoring sees HTTP 200 responses. It doesn't see that a prompt change tripled context size, a verbose model inflated output length, or an agent workflow entered a recursive loop—each silently multiplying costs.
Provider heterogeneity creates blind spots. Enterprise AI systems route across multiple models and providers (OpenAI, Anthropic, AWS Bedrock, internal models). Each has different performance characteristics, pricing structures, and failure modes. Standard health checks miss provider-specific degradation.
Quality degradation has no status code. An LLM can return HTTP 200 while delivering unusable output—hallucinating, missing formatting requirements, or ignoring instructions. Technical success doesn't equal actual success.
Traditional API Failure:
[Working] ─────> [Error 500] ─────> [Alert] ─────> [Fixed]
Binary state change triggers immediate response
AI System Degradation:
[Optimal] ─────> [Good] ─────> [Acceptable] ─────> [Poor] ─────> [Noticed]
Gradual decline across multiple thresholds before detection
These patterns explain why many enterprises discover AI issues only when users complain, finance flags cost anomalies, or engineers spend hours debugging production logs after the fact.
The Four Pillars of AI-Specific Observability
Effective monitoring for production AI systems requires tracking four distinct dimensions that reflect how LLM workloads actually behave:
1. Latency Across the Request Lifecycle
AI latency isn't monolithic. Total response time includes queue time, time-to-first-token (TTFT), generation speed, and end-to-end completion. Each reveals different failure modes:
- High queue time → capacity or rate limiting issues
- Slow TTFT → provider degradation or cold starts
- Reduced tokens/second → model or infrastructure problems
- Increasing total latency → compound system issues
Enterprise impact: For customer-facing applications, copilots, or real-time decision systems, latency directly impacts user experience and conversion. A chatbot that responds in 5 seconds instead of 1 second might technically "work," but functionally fails its purpose.
2. Token Consumption Patterns
Tokens are the fundamental unit of AI system behavior. Unexpected patterns often indicate issues before they manifest as user-facing problems:
- Input token anomalies: Context growth suggesting memory leaks in conversational systems; unexpected spikes indicating prompt injection or abuse
- Output token anomalies: Sudden verbosity increases from model or prompt changes; unusual patterns from formatting issues or repeated content
Enterprise impact: A 30% increase in average tokens per request with flat traffic volume signals a systemic issue—not growth. This often indicates prompt inefficiencies, agent workflow problems, or model behavior changes that require immediate investigation.
3. Error Patterns and Provider Reliability
AI systems fail across multiple layers, requiring nuanced categorization:
- Provider-level failures: Rate limiting (429), service outages (5xx), authentication issues, timeouts
- Model-level failures: Content filtering triggers, context length exceeded, refusals, invalid function calls
- Application-level failures: Output format mismatches, instruction-following failures, incomplete responses
Each category requires different remediation strategies. Provider outages trigger failover. Format mismatches suggest prompt refinement. Content filtering might indicate input validation gaps.
4. Cost Attribution and Anomaly Detection
Unlike traditional infrastructure where capacity is relatively fixed, AI costs scale unpredictably with usage patterns and model behavior. Smart cost monitoring doesn't just track spend—it detects anomalies:
- Sudden increases in average tokens per request
- Unexpected shifts in model selection patterns
- Context window growth indicating potential prompt issues
- Cost-per-outcome trends (e.g., cost per successful customer interaction)
Critical enterprise insight: A 40% cost increase with 40% more traffic is expected. A 40% cost increase with flat traffic indicates a systemic issue requiring immediate investigation.
Building Alert Strategies That Match AI Behavior
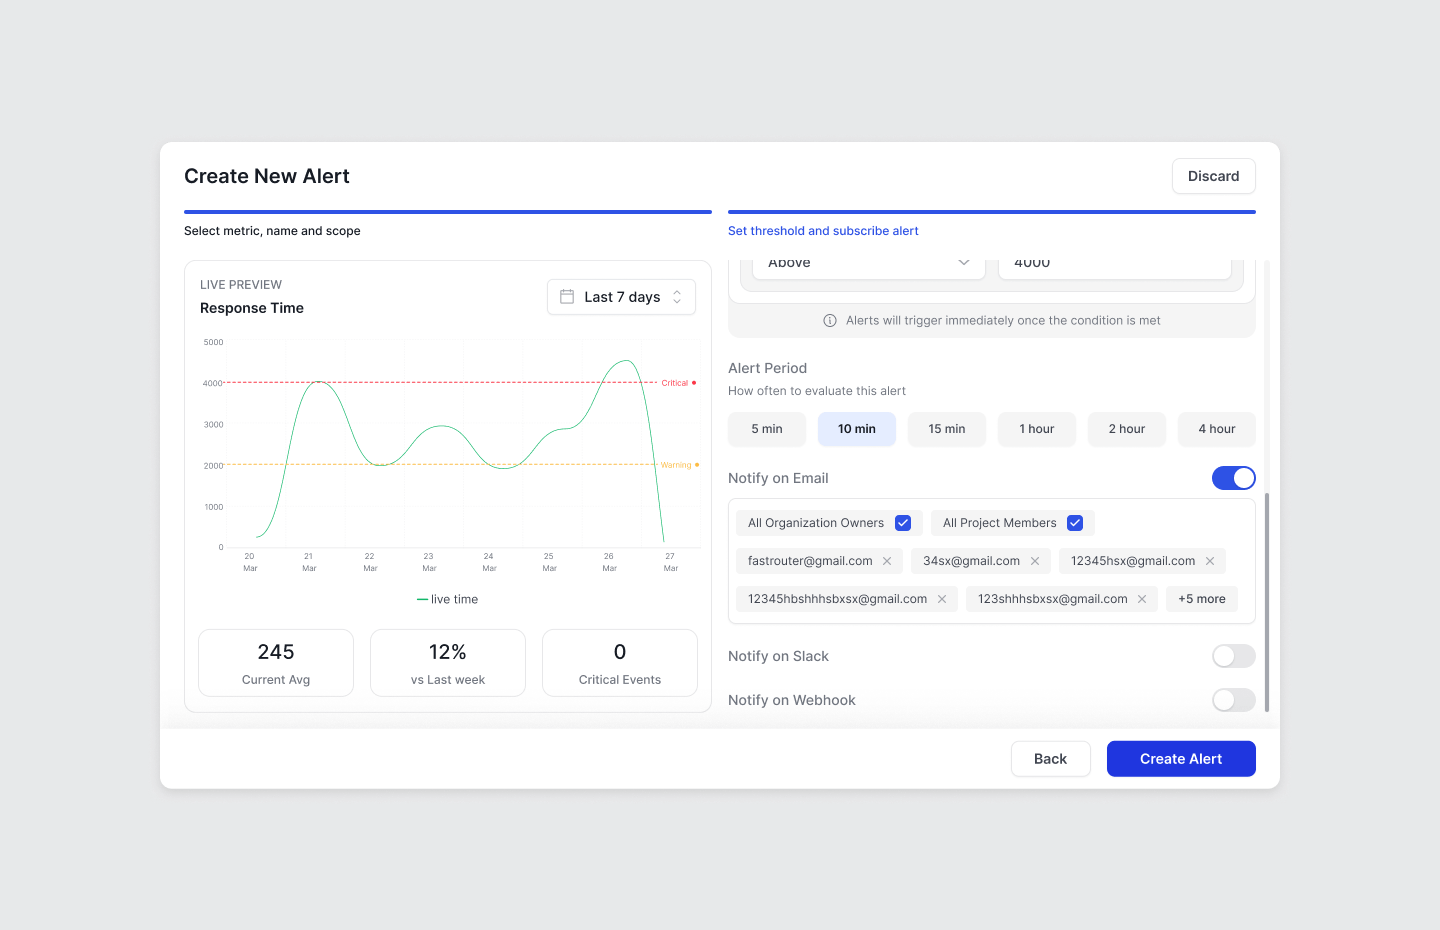
Effective alerting for AI systems requires moving beyond simple threshold monitoring to context-aware, multi-signal detection.
Threshold vs. Percentage Based Anomaly-Based Alerts
Static thresholds work for well-understood boundaries:
- Daily spend exceeding budget limits
- Latency above SLA requirements (e.g., p50 > 2 seconds)
- Error rate above reliability targets (e.g., >3%)
Percentage-Based Alerts
Percentage-based alerts detect relative changes in system behavior, helping teams catch anomalies before they become incidents.
Instead of relying only on static thresholds, these alerts compare current metrics against recent historical baselines.
Examples include:
- Daily spend increases relative to the previous day, indicating abnormal usage patterns or unexpected workload growth
- Latency spikes compared to the previous hour, signaling potential provider degradation or model congestion
- Error rate increases compared to the previous monitoring window, helping detect reliability issues across models or providers
This approach is particularly important for multi-model AI systems, where requests may be routed across several providers. A performance issue affecting one model can appear as subtle system-wide degradation rather than a clear failure.
Percentage-based alerts help teams detect these shifts early, before they impact users or budgets.
Granular Scoping
AI alerts should be configurable across multiple dimensions:
By workload:
- Customer-facing chatbot (low latency tolerance, high reliability requirement)
- Internal analysis tools (cost-sensitive, moderate latency tolerance)
- Batch processing (throughput-optimized, flexible on latency)
By provider:
- Premium providers (OpenAI GPT-4: high cost, high reliability expected)
- Alternative providers (Anthropic Claude: specific use cases, different performance profile)
- Local models (different performance characteristics, internal SLAs)
By environment:
- Production (strict thresholds, immediate escalation)
- Staging (warning signals, development feedback)
- Development (broad monitoring, learning mode)
Severity Tiering
Not all alerts require immediate escalation:
Critical (immediate response):
- Error rate >5% in production workload
- Spend rate exceeding 200% of budget projection
- Provider failover exhausted (all providers degraded)
Warning (investigate within hours):
- Latency trending 30% above baseline
- Token usage 50% above expected
- Single provider showing elevated errors
Informational (review in regular cycle):
- New cost patterns detected
- Performance variation within acceptable range
- Provider-reported degradation in non-critical region
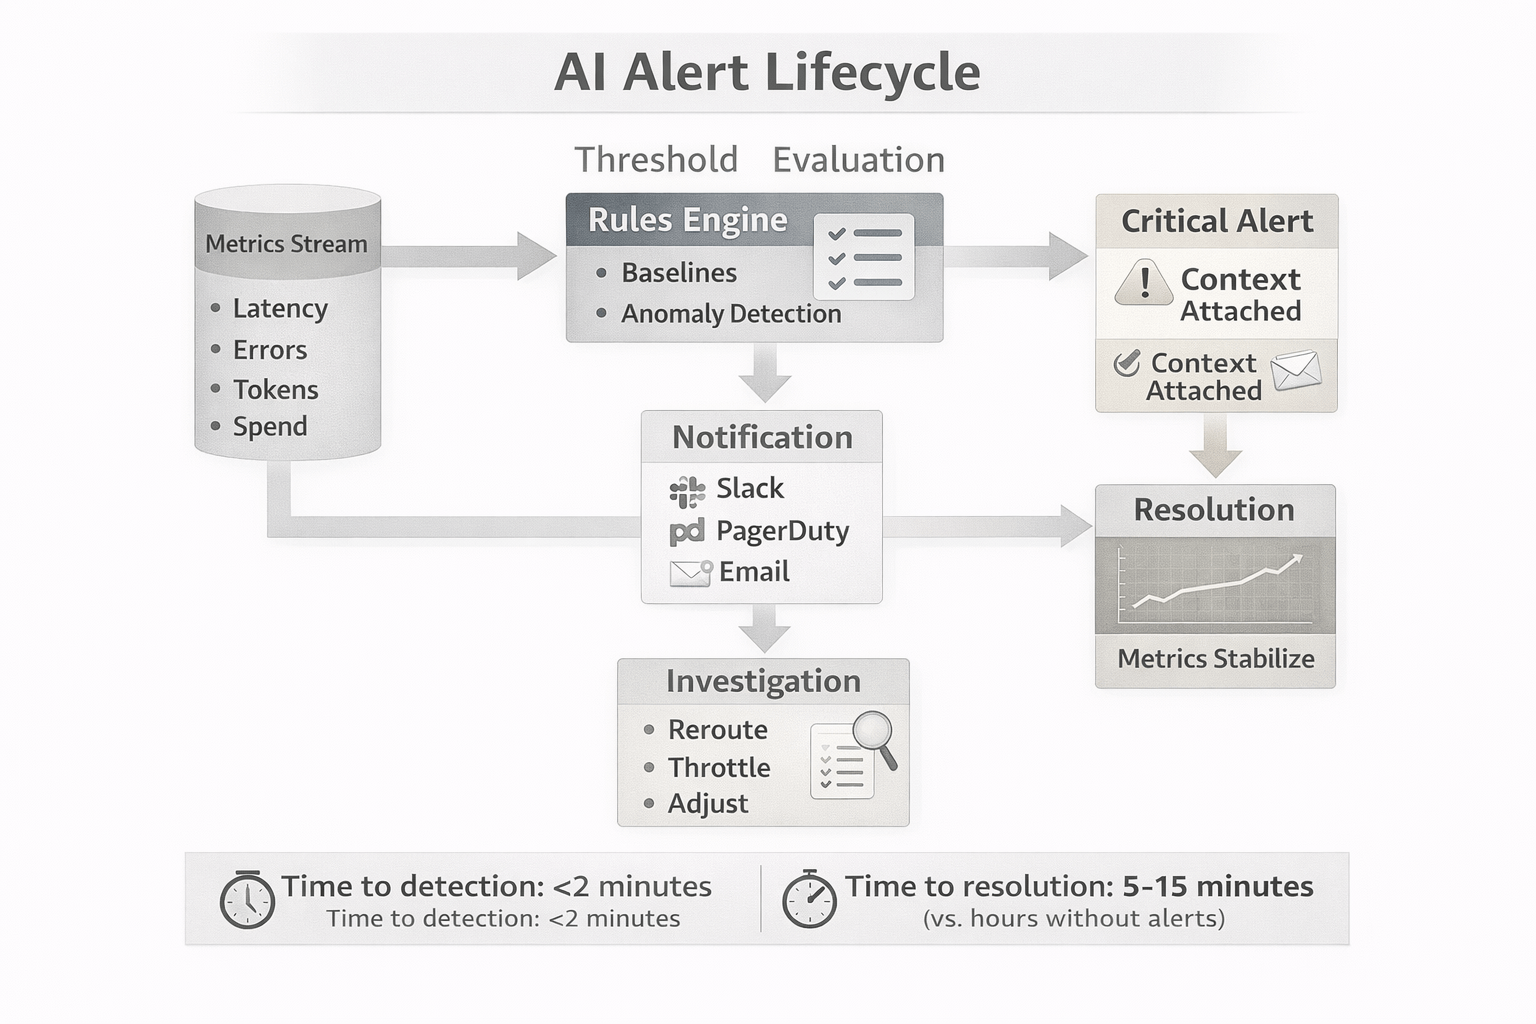
[Visual: Alert Lifecycle Flow]
A Production Scenario: Preventing Cascading Failures
Consider a Fortune 500 company running an AI-powered customer support system handling 10,000 conversations daily.
Normal operating conditions:
- Median response time: 900ms
- Daily spend: $120
- Error rate: <1%
The incident:
A primary model provider experiences regional degradation. P50 latency climbs to 3.5 seconds. Error rate spikes intermittently to 4-5%.
Without AI-native monitoring:
10:15 AM — Provider slows down; p50 latency exceeds 3 seconds
10:30 AM — Error rate begins spiking
11:00 AM — First customer complaints reach support
11:30 AM — Engineering investigates logs, identifies provider issue
11:45 AM — Traffic manually rerouted
Afternoon — Team writes postmortem
Total impact: 90+ minutes of degraded experience, multiple customer complaints, SLA breach, reactive firefighting.
With intelligent alerting:
10:16 AM — Latency alert fires: p50 >2 seconds for "Support Chatbot"
10:18 AM — Error rate alert reports spike >3× baseline
10:19 AM — On-call receives notification with context: provider latency increased, error codes show timeouts, no recent deployment
10:21 AM — Team reroutes traffic to backup provider
10:25 AM — Latency and error rates recover; alerts auto-resolve
Total impact: <10 minutes of minor degradation, minimal user impact, proactive response.
The difference isn't the alert itself—it's the time compression between issue onset and resolution. That compression is what users experience.
From Observability to Control: The Operational Maturity Curve
Alerts are one component of a broader AI operations strategy. The most mature enterprises combine monitoring with:
- Multi-provider routing to automatically shift traffic based on performance and cost
- Cost controls and budgets enforced at project and organization levels
- Usage analytics to understand how changes affect performance and spend
- Automated response patterns for common failure modes
This transforms AI infrastructure from a black box into a managed control plane—something teams can observe, govern, and continuously improve.
The enterprise AI maturity progression:
- Reactive: Discover issues through user complaints or monthly invoices
- Monitored: Track metrics but respond manually
- Alerted: Automated notifications enable faster response
- Governed: Automated controls prevent issues before they impact users
- Optimized: Continuous feedback loops drive performance and cost improvements
Most organizations deploying production AI are currently between stages 1 and 2. Moving to stage 3+ requires treating AI observability as a first-class infrastructure concern, not an afterthought.
Practical Implementation Checklist
If you're running AI in production, evaluate your current observability against these criteria:
Latency monitoring:
☐ Track Time to First Token and End to End Response times independently
☐ Monitor time-to-first-token separately from total latency
☐ Alert on latency degradation trends, not just absolute thresholds
Cost visibility:
☐ Attribute costs to specific workloads/projects
☐ Track cost-per-outcome metrics, not just total spend
☐ Alert on unexpected cost-per-request increases
Error tracking:
☐ Categorize errors by type (provider, model, application)
☐ Monitor error patterns across providers for failover intelligence
☐ Track error impact (did retries succeed? was fallback needed?)
Token analytics:
☐ Monitor input/output token distributions separately
☐ Alert on unexpected token consumption patterns
☐ Track token efficiency trends over time
Provider diversity:
☐ Monitor each provider independently
☐ Track provider-specific failure modes
☐ Measure failover effectiveness
If you're missing more than two categories, you're likely operating with significant blind spots in your AI infrastructure.
Final Thoughts: Observability as Competitive Advantage
As AI systems transition from experimental to mission-critical, observability moves from nice-to-have to table stakes. The organizations that master AI monitoring will:
- Maintain reliability while competitors struggle with unexplained degradation
- Control costs while others face budget overruns
- Iterate faster with confidence in system behavior
- Scale safely with visibility into performance boundaries
The gap between companies with sophisticated AI observability and those without will widen—not because monitoring itself is a differentiator, but because you can't optimize what you can't measure.
Most teams invest enormous effort in prompt engineering and model selection. Once AI reaches production, observability becomes just as critical as model quality. The question isn't whether you need specialized monitoring for AI workloads. It's whether you'll build comprehensive observability in-house or adopt purpose-built solutions that provide AI-native monitoring out of the box.
Either way, the era of running AI systems without granular, real-time observability is ending. The only question is how much user impact and budget waste you'll tolerate before making the investment.
Modern AI infrastructure requires modern observability approaches. Tools designed specifically for LLM workloads—monitoring latency, cost, errors, and token usage in real time—are emerging as essential components of enterprise AI operations.
Related Articles
.png&w=3840&q=100)
Tokenmaxxing Is a Governance Problem, Not a Productivity Problem
Amazon shut down a token leaderboard. Uber burned through its AI budget in a quarter. This is not an AI hype problem — it is what happens when usage scales without governance
.png&w=3840&q=100)
AI Spend Management: What Engineering Leaders Need to Get Right in 2026
AI Spend Management: What Engineering Leaders Need to Get Right in 2026
.png&w=3840&q=100)
Your Prompts Are Hardcoded Strings and It's Costing You Hours Every Week
Stop deploying code just to update a prompt. FastRouter Prompt Library gives you versioning, instant rollback, and GEPA optimization.